BCE Custom Reports and Dashboards

- Introduction
- Setup and User Administration
- Accessing Dashboards and Custom Reports
- Access Permissions
- Ad Hoc Views
- Choose Data
- New Ad Hoc View
- Columns
- Groups
- Filters
- Select Fields
- Calculated Fields
- Ad Hoc View - Toolbar Controls
- Column Properties
- Ad Hoc View – Folder Structure
- Saving an Ad Hoc View
- Edit Ad Hoc View
- Custom Reports
- Search
- Advanced Search
- Preview Report
- Actions – Set Report Location
- Modify/Clear Location
- Create a Custom Report
- Edit/View - Custom Report
- Dashboards
- Create a new Dashboard
- Edit/View/Delete Dashboard
- Dashboard functions
- Example Dashboards and Reports
- Example - Sales Revenue Dashboard
- Example- Sales Custom Report
Introduction
‘Custom Reports and Dashboards’ provide powerful and flexible reporting options to access the BCE data.
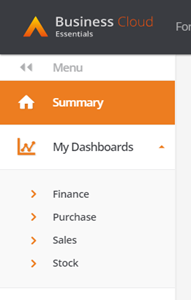
Customised dashboards accessible from the ‘My Dashboards’ menu provide users with options to report on their business performance.
The configurable dashboards provide a high level view of the data that can be setup and presented as key performance indicators (KPI’s) using a graphical representation of the data with the ability to drill down to the underlying data.
Custom reports is a powerful reporting tool that allows users to create and manage their business and financial reports. Custom reports add the flexibility of being able to assemble reports from user defined data fields with the ability to apply data sort and filter options and introduce calculation and total fields.
Custom reports and dashboards are built from ‘Ad Hoc Views’, a collection of specified data fields created from sets of the following data domains:
- Sales
- Finance
- Stock
- Purchase
- CRM CRM Domain Fields.xlsx
Individual access permissions control each user’s ability to create, manage and access the dashboards and custom reports.
A pdf copy of this document can be downloaded from here
A 'Custom Reports and Dashboards' YouTube video can be viewed from here
If you would like to see our elearning content please click here
Setup and User Administration
Accessing Dashboards and Custom Reports
Access to Custom Reports and to Dashboards is controlled from each users’ access permissions.
When access is enabled:
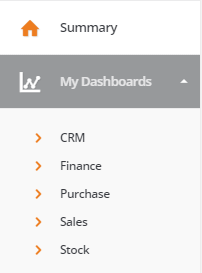
‘My Dashboards’ is available from the BCE main menu:
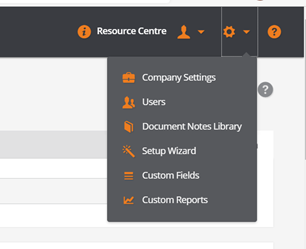
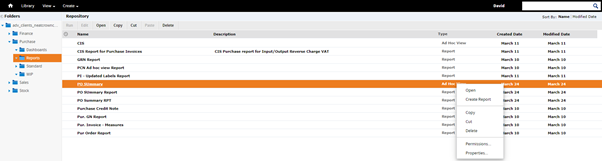
Custom Reports’ is available from the BCE systems setting menu:
Access Permissions
Users can be set up to view custom reports and dashboards or as administrators who have the ability to create the ad hoc views that are required to support the dashboards and custom reports.
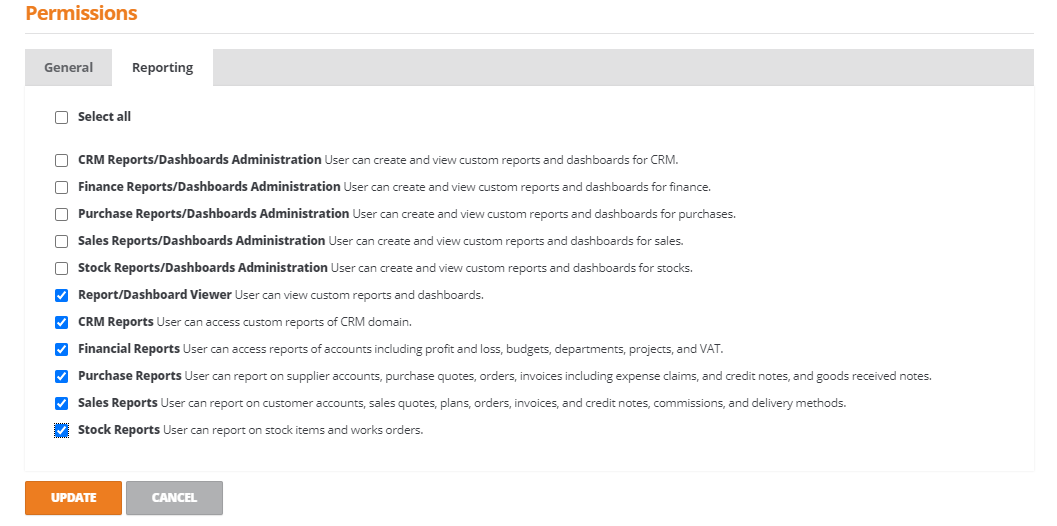
Administrators
Permissions to create and manage custom reports and dashboards are set for a user from the ‘Reporting tab:
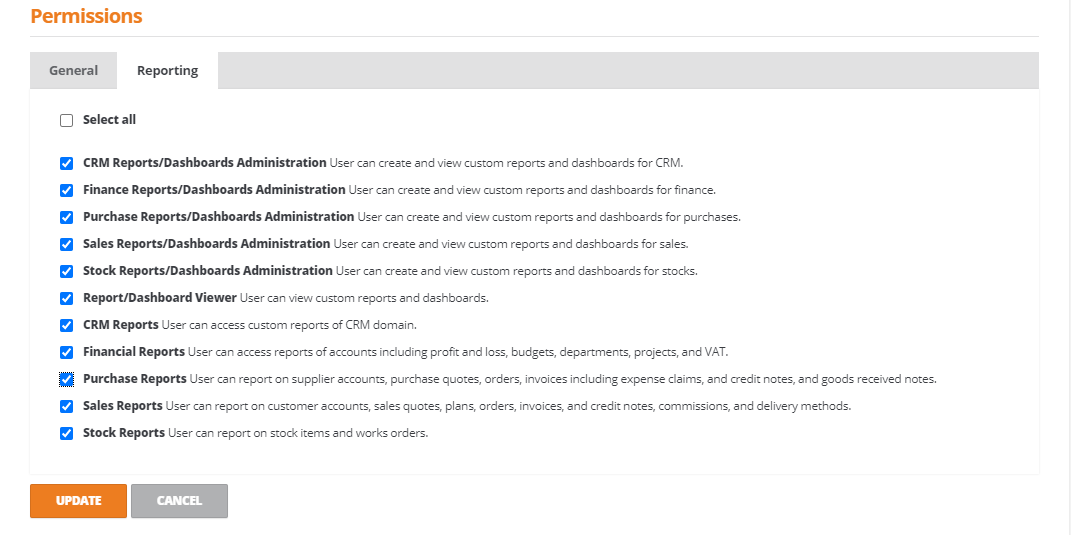
An administrator has the ability to create ad hoc views and to edit dashboards and custom reports for any combination of the of the following data domains:
- CRM Reports/Dashboard Administration
- Finance Reports/Dashboard Administration
- Purchase Reports/Dashboard Administration
- Sales Reports/Dashboard Administration
- Stock Reports/Dashboard Administration
Select the required permissions by ticking the individual boxes or tick ‘Select all’ if all permissions are required.
Click the ‘Update’ button to save the changes.
Viewer Permissions
Users can be set up to view custom reports and dashboards or to view just the custom reports using the following options:
To view custom reports and dashboards, select the ‘Report/Dashboard Viewer’ and any one of the five report types:
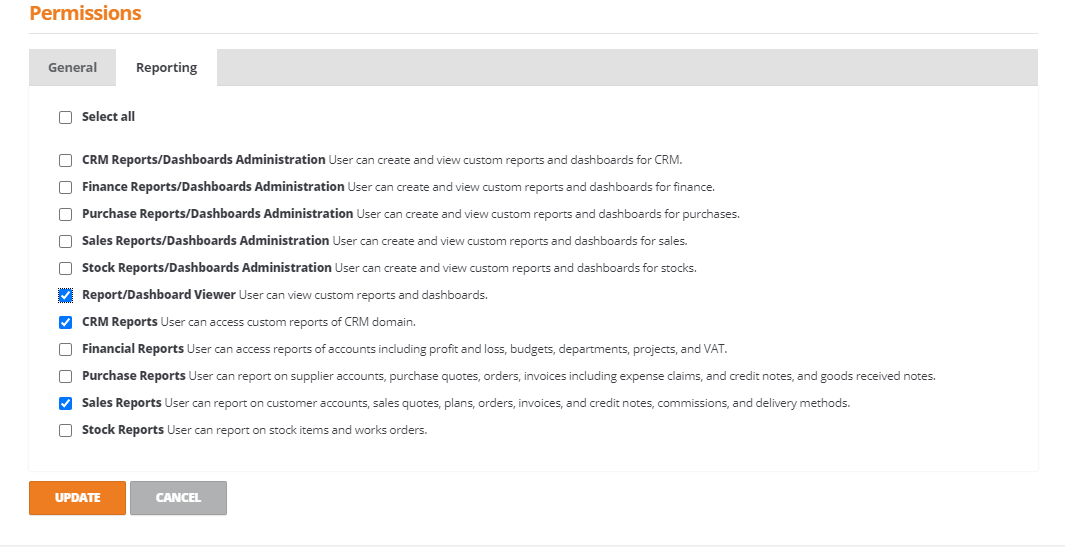
The ‘Report/Dashboard Viewer’ permission is used in association with the report:
- CRM Reports
- Financial Reports
- Sales Reports
- Stock Reports
- Purchase Reports
For example, granting access to ‘Report/Dashboard Viewer’ and ‘Sales Reports’ permits the user to access the sales dashboards and custom reports only.
Users can be restricted to view custom reports using the following options:
Any combination of the permissions can be selected for:
- CRM Reports
- Financial Reports
- Sales Reports
- Stock Reports
- Purchase Reports
Select the required permissions by ticking the individual boxes required.
Click the ‘Update’ button to save the changes.
Ad Hoc Views
An ‘Ad Hoc View’ is a collection of data fields, measures and filters that form the basis of a report are required by both the dashboards and custom reports.
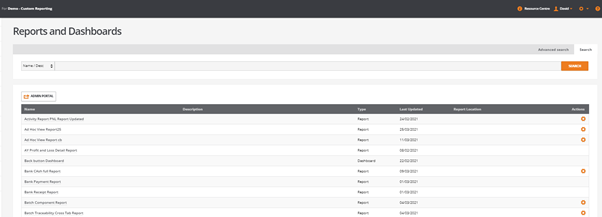
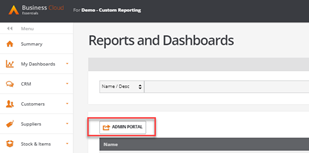
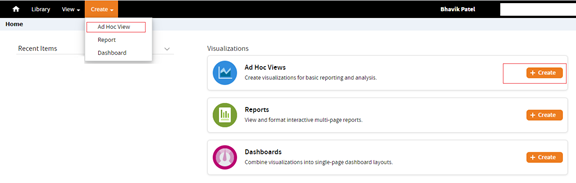
From ‘Reports and Dashboards’ select the ‘Admin Portal’ to open the ‘Home’ screen:
From the ‘Home’ screen click on the ‘+Create’ button from the ‘Visualizations’ area:
Each ad hoc view is based on one of the data domains, select the relevant data domain for the custom report or dashboard:
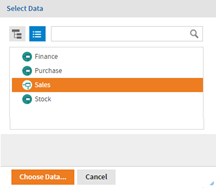
With the domain highlighted click on ‘Choose Data…’ to open the ‘Choose Data’ screen:
Choose Data
BCE data is grouped together into logical data sets containing data fields. These data sets are displayed within a list from the ‘Source’ view.
Complete data sets or individual data fields can be selected and included within an ad hoc view:
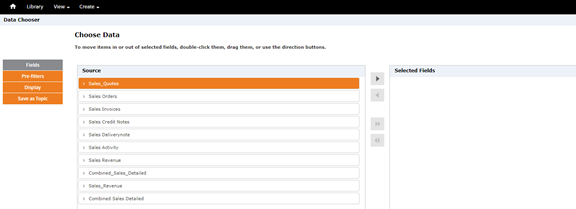
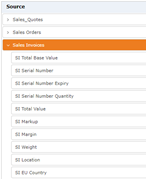
From the ‘Source’ list, data sets can be expanded by clicking on the ‘>’ to the left of the data set name. This opens the contents of the data set to reveal individual data fields:
Any number of the data sets or data fields can be selected from the source list:
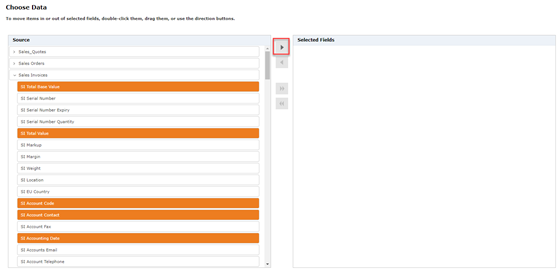
Once the data fields have been selected, click on the arrow icon located between the ‘Source’ and ‘Selected Fields’ windows to move the fields to the ‘Selected Fields’ table.
Selecting a complete data set will move the entire data set including all of its data fields:
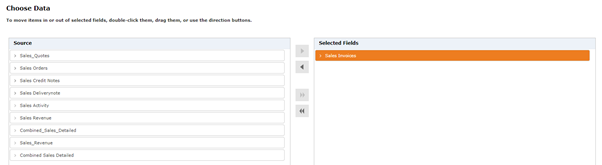
Data set and data field selections are easily managed using the options to expand the data sets and by using the selection arrows to include or exclude data fields as required.
Once the required data sets and fields have been selected, click ‘OK’ to open the ‘New Ad Hoc View’.
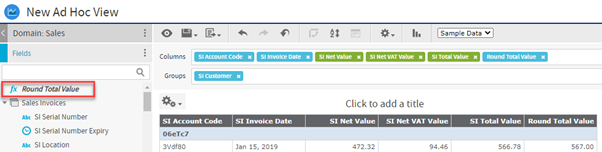
New Ad Hoc View
From the ‘New Ad Hoc View’, all available data fields are displayed on the left of the screen within two panels labelled:
· Fields Alpha-numeric fields
· Measures Numeric fields
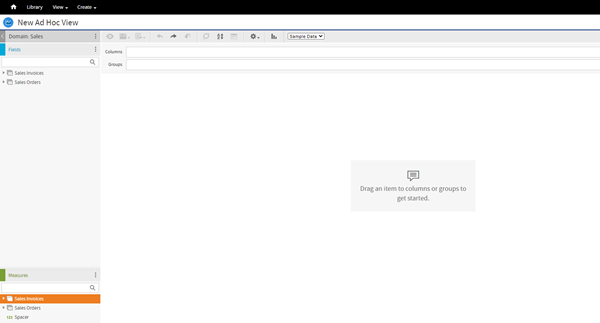
Construction of the ad hoc view can now begin by populating the views columns, applying groups for arranging data and introducing calculation formulas, sort and filter options.
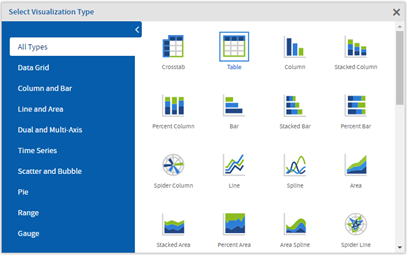
Visualization type
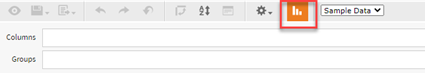
Select the visualization type to support:
Custom report: Select from Data Grid (Table is recommended)
Dashboard: Select from any of the chart types
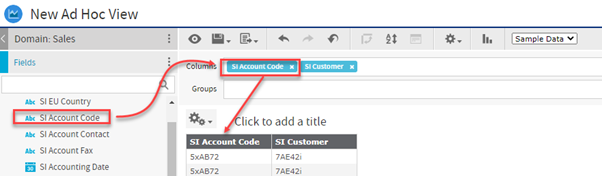
Columns
From ‘Fields’, select the data fields required for the report by dragging the field directly into the ‘Columns’ area.
As each field is moved into ‘Columns’, the data columns appear within the body of the report:
Notes:
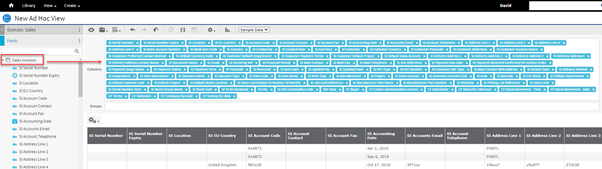
Double clicking on a data field name moves the field directly into the ‘Columns’ field.
An entire ‘data set’ can be dragged (or double clicked) to move it into ‘Columns’ where all fields are automatically expanded:
From the ‘Columns’ area, data fields can be removed or arranged into any order to represent the final order of the required report layout.
Depending on the report or dashboard requirements, it is best practice to only select the data fields required for the ad hoc view.
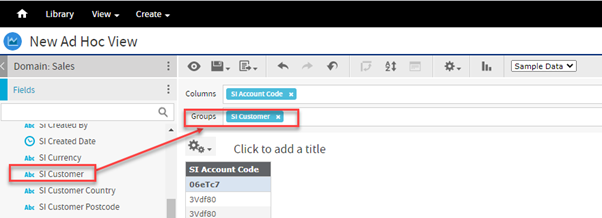
Groups
To group data to separate on sub sets within a custom report, drag the data field into the ‘Groups’ area.
This example will group the reported data by customer:
Data fields from the ‘Measures’ panel cannot be used for grouping data if the measure is already selected to be included in a view.
However, it is possible to select measure fields by right clicking and selecting the option to ‘Use as Field’.
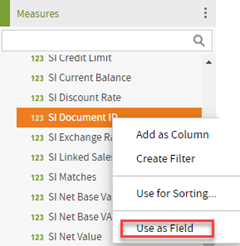
This moves the data field from the ‘Measures’ list to the ‘Fields’ list where it can be selected for groups:
Filters
Filters can be applied to data fields and columns by right clicking on the field name and selecting ‘Create Filter’:
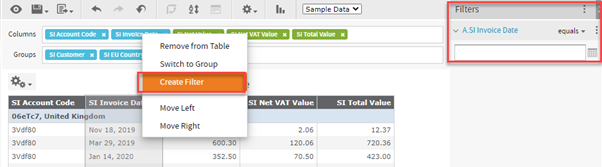
This creates a ‘Filters’ view located on the right of the screen where specific filter options can be setup:
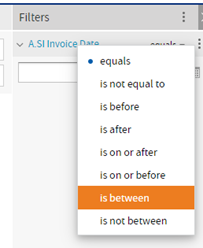
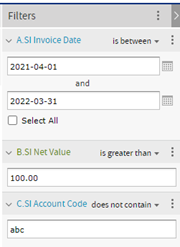
For example, selecting the ‘equals’ option for a date format field allows the parameters and date range values to be set:
Select Fields
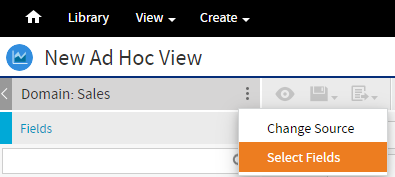
An ad hoc view can be refined using the ‘Select Fields’ option to add or remove data sets or data fields to those originally assigned on creation of the ad hoc view.
From the domain name click on the triple dots to open the following menu:
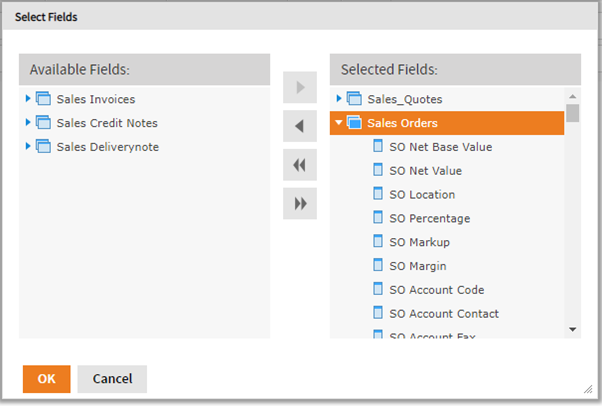
Clicking on ‘Select Fields’, opens the following screen where data fields can be moved between the ‘Available Fields’ and ‘Selected Fields’ lists using the directional arrows as required:
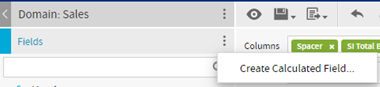
Calculated Fields
Calculated fields are introduced by right clicking on the triple dots adjacent to the ‘Fields’ heading and selecting ‘Create Calculated Field’:
This opens the ‘Calculated Field’ window where formulas and their operations can be set up for data fields and measures using a variety of functions:
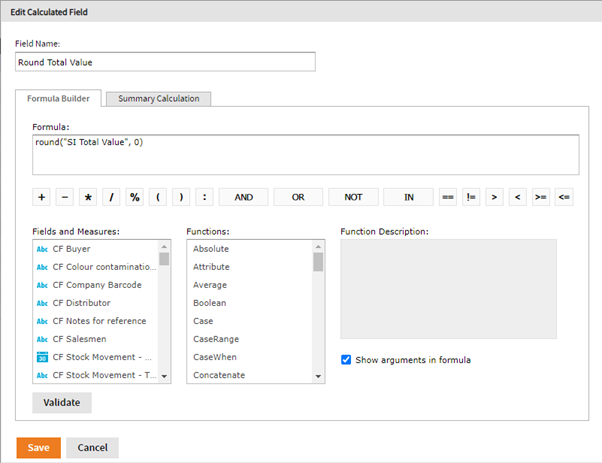
When a formula has been defined and validated, it is saved and the calculation field will appear in the ‘Fields’ panel from the ad hoc view:
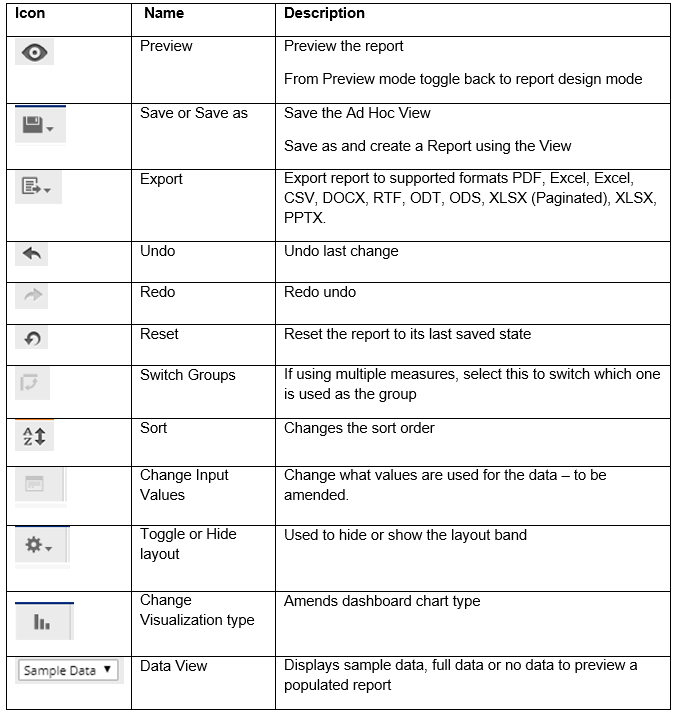
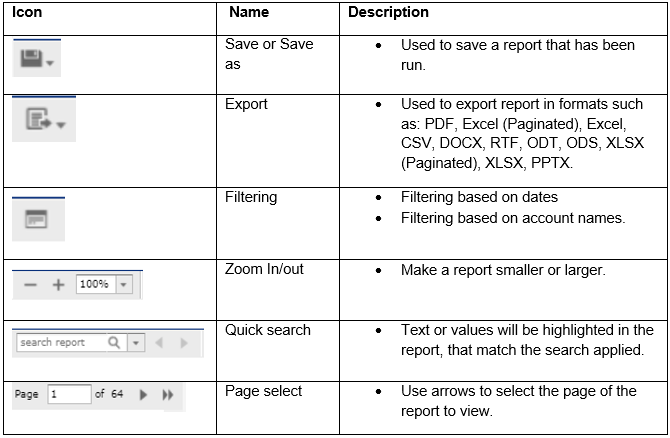
Ad Hoc View - Toolbar Controls
This table provides a brief explanation of each of the toolbar icons:
Column Properties
Right clicking on a column provides column property options to label, format and reposition the selected column:
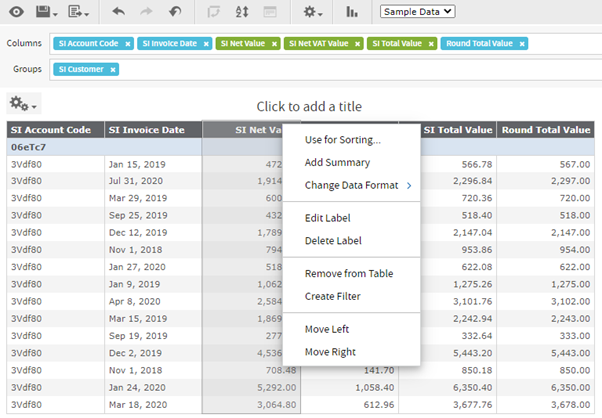
For example, ‘Add Summary’ will introduce a column total to the select column.
Ad Hoc View – Folder Structure
When saving or locating ad hoc views, the files should be stored within their correct folder within their corresponding data domain:
For each data domain the following folders are setup and used for storing:
Dashboards:
User created Dashboards and their supporting ad hoc views
Reports:
User created Custom reports and their supporting ad hoc views
Standard:
Reserved for Advanced sample dashboards, custom reports and their ad hoc views
The dashboards, custom reports and their ad hoc views cannot be deleted.
These can be copied and used for the basis of new dashboards, custom reports and their ad hoc views.
WIP:
User created dashboards, custom reports and their ad hoc views in construction.
These are not published on the Reports and Dashboards list
Saving an Ad Hoc View
When an ad hoc view is complete, click on the ‘Save’ icon to save using one of the following options:
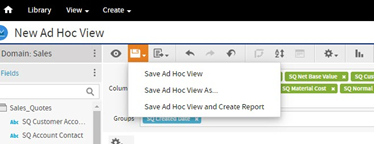
Save Ad Hoc View:
Saves the Ad Hoc View
Save Ad Hoc View As…:
Saves a new copy of the Ad Hoc View
Save Ad Hoc View and create Report:
Allows the Ad Hoc View to be saved and a report created
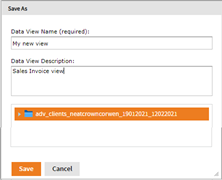
For ‘Save’ and ‘Save as’, complete a data view name and description:
When selecting ‘Save and create Report’ the following screen opens:
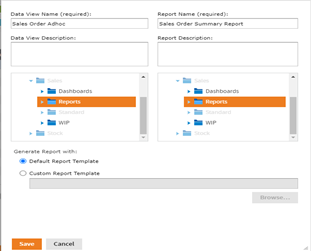
Compete the data view name and description and enter a report name and description. Select the folder to store both the view and report and select the ‘Save’ button to save the view and the report.
The following message is displayed confirming the report was saved successfully:

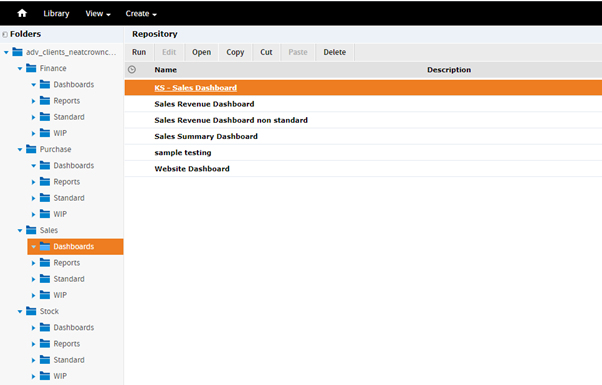
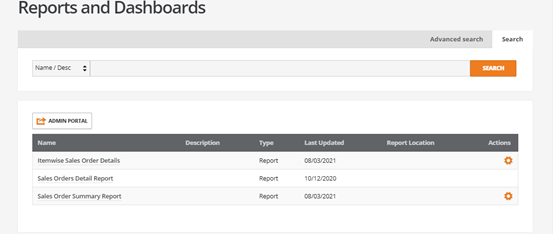
The saved report is available from the ‘Reports and Dashboards’ list screen:
Edit Ad Hoc View
Changes to the contents of custom reports and dashboards can only be applied by editing the supporting ad hoc view.
To edit an existing ‘Ad Hoc View’, from the ‘View’ dropdown menu, select ‘Repository’:
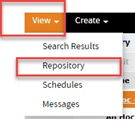
From the list of domains and folders, locate the view and double click on the ad hoc view to open for edit:
The view can now be changed as required, for example the addition of an addition columns for a custom report is performed by editing the ad hoc view and modifying the contents of the columns, groups or filters
When the changes are complete, click on the save icon to save the changes to the Ad Hoc View.
Note: Changes saved to ad hoc views supporting dashboards will immediately update the dashboard view.
Custom Reports
To access Custom Reports, select ‘Custom Reports’ from the System dropdown menu:
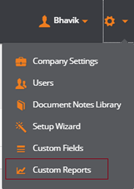
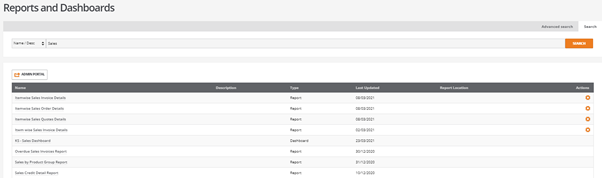
The ‘Reports and Dashboards’ list screen opens displaying all the custom reports and dashboards that the user has permissions to view:
Search
The search option allows custom reports and dashboards to be found by their name or description.
Enter a part name or any string of characters to return results matching the value entered:
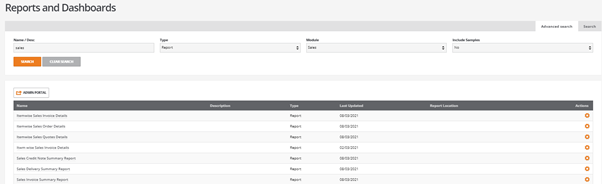
Advanced Search
This extends the search options to find custom reports and dashboards by:
Type:
Report, Dashboard or both
Module:
Select from any of the data domain or all
Include Samples:
‘Yes’ includes sample reports and dashboards shipped with BCE
‘No’ excludes the sample reports and dashboards
Preview Report
Custom report are viewed from the ‘Reports and Dashboard’ list screen or from its designated report menu location, by clicking on the report name.
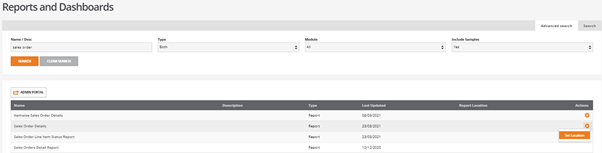
Actions – Set Report Location
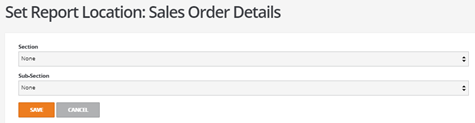
Where the action cog is displayed for reports there is an option to ‘Set location’:
Clicking on ‘Set location’ opens the following screen where the report can be assigned to a specified menu section and sub section:
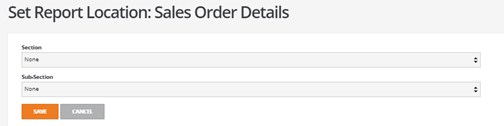
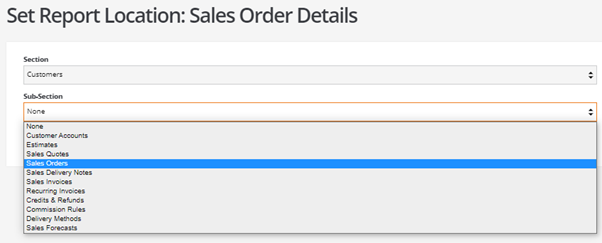
For example, Sales Order Details can be assigned to the ‘Customers’ menu:
The report can be positioned within the ‘Sales Orders’ sub menu:
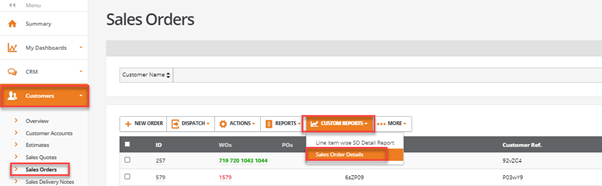
When saved, a ‘CUSTOM REPORTS’ tab is introduced to the ‘Customers’, ‘Sales Orders’ menu and the custom report will be available from the dropdown menu:
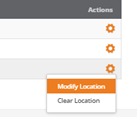
Modify/Clear Location
When a location has been set for a report the use of ‘Set Location’ changes and permits an existing location to be changed or removed:
Create a Custom Report
To create a new report it is recommended that a new ad hoc view is created or an existing report is modified and saved from the Ad Hoc Views.
Edit/View - Custom Report
To edit or view an existing custom report it is recommended that this is performed from the Ad Hoc Views.
Note: The creation and maintenance of custom reports can only be performed by users with administrative permissions.
Custom Report - Toolbar Controls
This table provides a brief explanation of each of the toolbar icons used when editing or viewing a report:
Dashboards
Dashboards, accessed from the ‘My Dashboards’ menu provide a high level view of your business data.
Configurable dashboards are setup and presented as key performance indicators (KPI’s) using a graphical representation of the data with options to drill down into the underlying data.
Note: The creation and maintenance of dashboards can only be performed by user with administrative permissions.
Create a new Dashboard
To create a new dashboard it is recommended that a new ad hoc view is created or an existing dashboard is modified and saved from the Ad Hoc Views.
Edit/View/Delete Dashboard
To edit, view or delete an existing dashboard it is recommended that this is performed from the Ad Hoc Views.
Dashboard functions
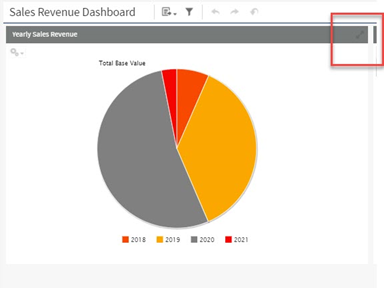
Expanding a KPI
A KPI display can be resized using the arrow icon to expand to a full screen or retract to a tile:
Drilldown of KPI data
Clinking on a KPI bar, line point or pie area, a drill down will load a custom report view of the data to display the underlying detail for the graph.
Tooltips
Positioning the mouse over any part of a KPIs graph displays a tooltip containing high level data details.
Export Dashboard
A dashboard can be exported to one of several output formats using the ‘Export Dashboard’ icon:
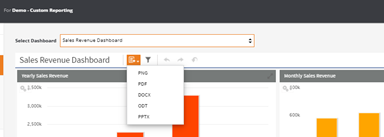
Chart Types
Chart Types can be used to change the presentation format of the KPI:
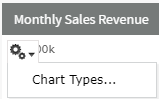
Select the icon located on the top left of the current chart to open the following screen:
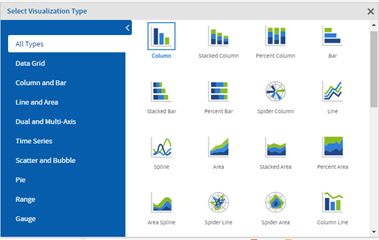
Note: The system will not permit the selection of incompatible chart types relative to the data content.
Example Dashboards and Reports
The following example sample dashboards and reports are supplied for user reference:
Sales - Dashboard
Sales Revenue Dashboard
Sales - Reports
Invoice Awaiting Payment Report
Finance - Dashboard
Working Capital
CY-Profit & Loss
FP-Profit & Loss
Finance - Reports
Bank Payment Report
Bank Receipt Report
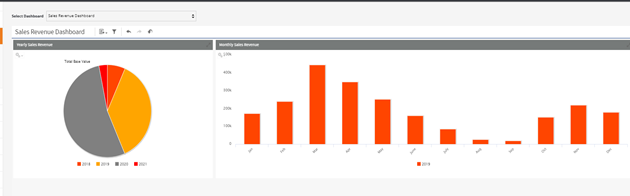
Example - Sales Revenue Dashboard
From ‘Dashboards’ locate the ‘Sales Revenue Dashboard’ from the ‘Sales’ menu.
This example displays individual KPIs with options to drill down to show the detailed report:
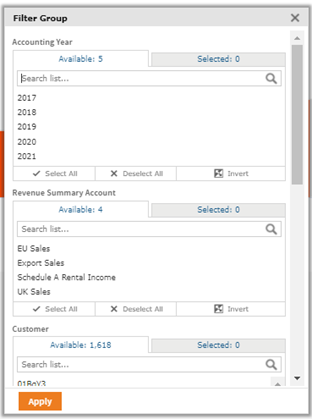
Filter
The ‘Filter’ Icon can be used to refine the display by specific year, multiple years, sales revenue summary account, customer, project or department:
Sales KPIs
The following example KPIs are available in the Sales Revenue Dashboard are:
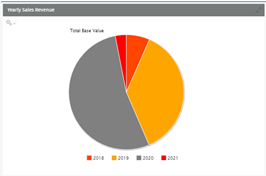
Yearly Sales
Displays the Sales Revenue for one year or more years:
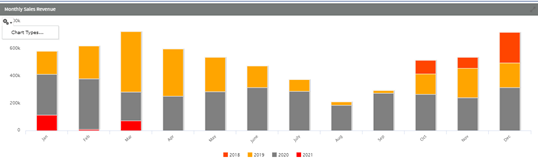
Monthly Sales Revenue
Displays the Sales Revenue for each month:
Note: The graph type can be changes by selecting ‘Chart Type’ and a column based views can be selected as required:
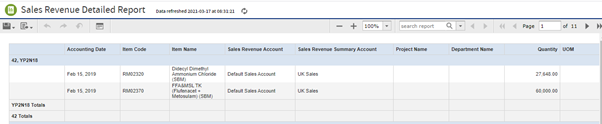
A drilldown is available by selecting an individual month. This opens a detailed report of the monthly sales revenue with breakdown to document level:
Filters can be applied to the dashboard and these are retained.
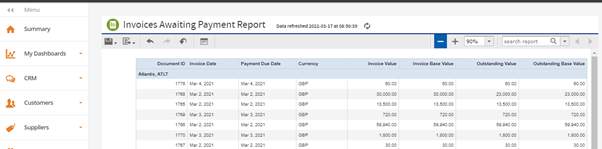
Example- Sales Custom Report
Invoices Awaiting Payment Report
From ‘Reports and Dashboards’ locate the custom reports ‘Invoices Awaiting Payment’:
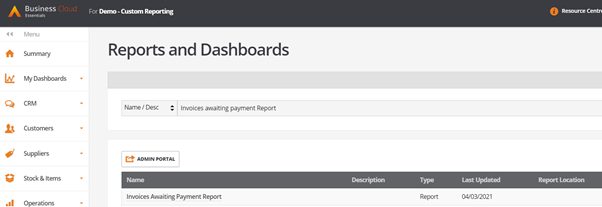
The report displays all invoices that are not settled or partially outstanding and can be filtered by customer, date, or by the payment status: