Standard Reports and Dashboards
Introduction
Custom reports includes a number of predefined standard reports and dashboards. These example template reports and dashboards can be used for reference to illustrate how report and dashboards can be assembled to report on their data.
The content of the Standard reports and Adhoc views from the 'Standard' folder cannot be edited or deleted, however, all the Standard reports and Adhoc views can be copied, have their contents edited and saved as user created reports.
Standard Reports
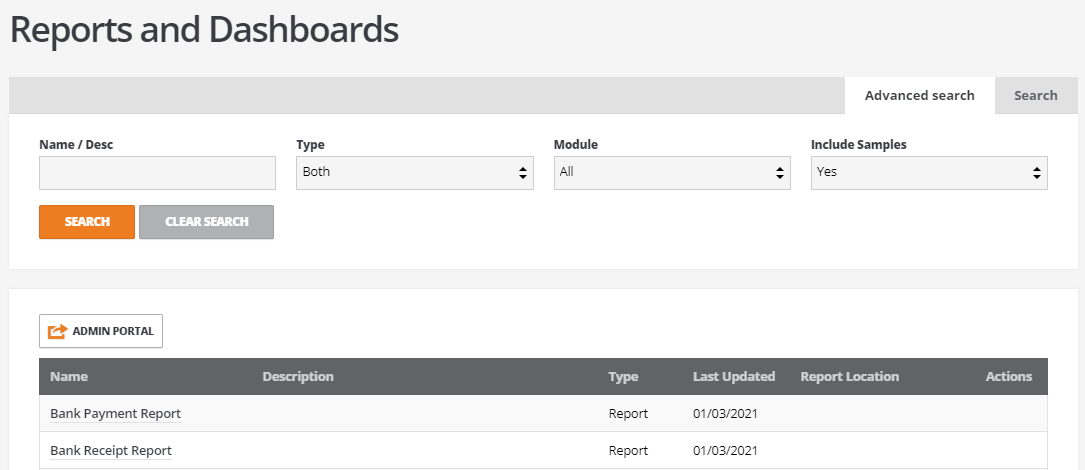
Standard reports are built from ‘Ad Hoc Views’, using a collection of specific data fields selected from domains. These reports can be viewed the from 'Reports and Dashboards' screen
The following example standard reports can be used for reference:
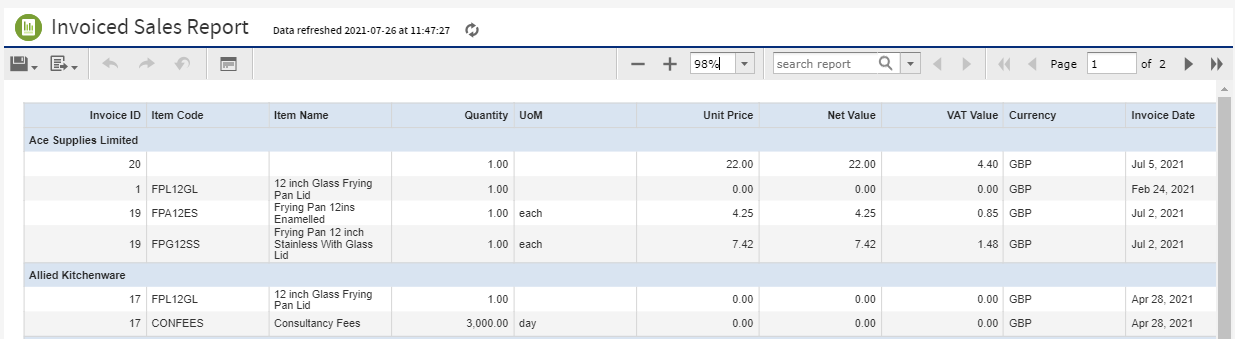
Invoiced Sales Report
This report uses the Sales Domain > Sales Invoice set
This report lists sales by stock item value with multiple filters to search records:
Report Filters
Invoiced Sales Report includes multiple filters such as:
- Customer - The option to select one or multiple customers
- Invoice Date - 'From date' and 'To date' can be selected to search records. By default, the system lists One Year record from current date
- Item Name - Option to select one or multiple Items
- Item Type - Option to search sales for item type. For example 'Stock item', 'Consumable', 'Service' etc. can be selected
- Reversed - To filter out Reversed Sales Invoices
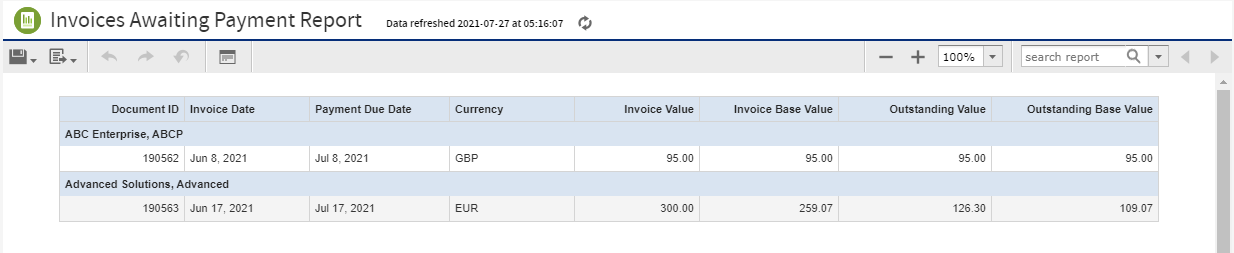
Invoices Awaiting Payment Report
This report uses the Sales Domain > Sales Invoice set
This report lists all sales invoices which are awaiting payments from customers and includes sales invoices which are fully outstanding or part paid together with their outstanding value.
Invoice Value and Outstanding values can be seen in base currency i.e. GBP as well as document currency
Report Filters
- Customer - Option to select one or multiple customers
- Payment due date - A date range can be selected to search records. By default, the system lists One Year record from current date
- Payment Status - Option to filter on part paid and outstanding invoices
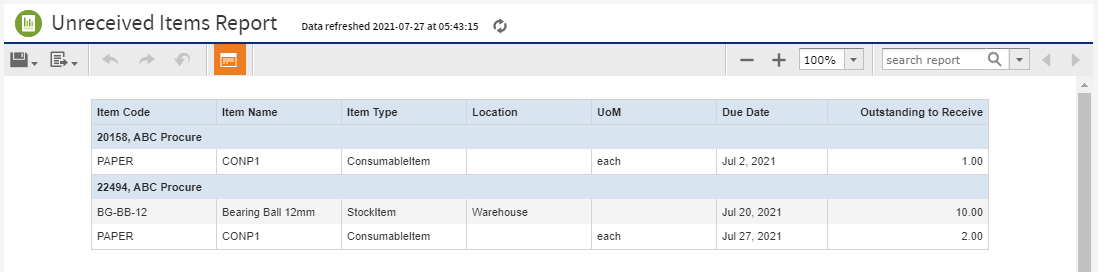
Unreceived items report
This report uses the Purchase Domain > Purchase order set.
Reports on the quantity of items outstanding on purchase orders that are awaiting to be received are displayed in this report. Purchase orders that have been cancelled are not reported .
Report Filters
- Supplier - Option to filter records by supplier
- Item Type
- Location
- Due Date - A date range can be selected to search records
- Order Status
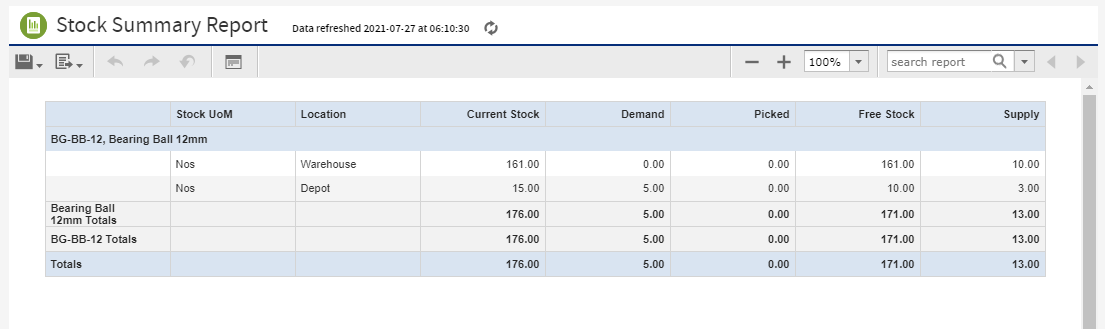
Stock Summary Report
This report uses the Stock Domain > Stock and Stock Location set
This report is equivalent to the BCE 'Stock Quantity Detail Report' but includes an additional field named 'Stock code'.
The report is grouped by stock code and stock name
Report Filters
- Stock Name - Allows search of one or multiple stock items at a single point of time
- Location - Option to search records for one or multiple stock locations
- Obsolete - Option to filter out obsolete stock
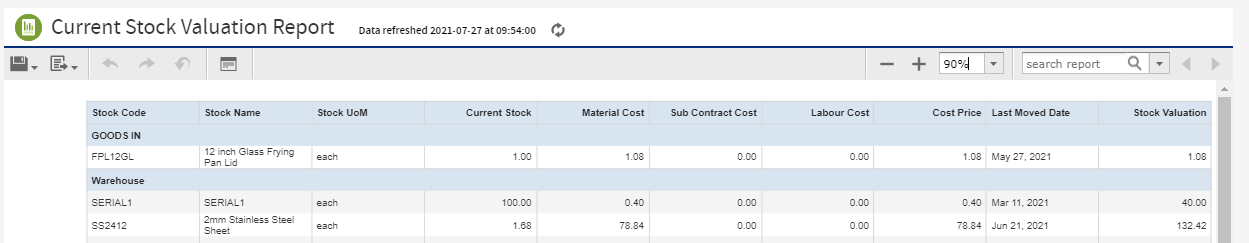
Current Stock Valuation Report
This report uses the Stock domain > Stock and Stock location set
This report shows the valuation of stock items using 'Current stock quantity * Current cost price' of a stock item
This report shows the valuation of stock currently held by location as at today and shows the last moved date of stock movement
Report Filters
- Stock Items - Option to filter one or multiple stock items
- Stock location
- Stock Group
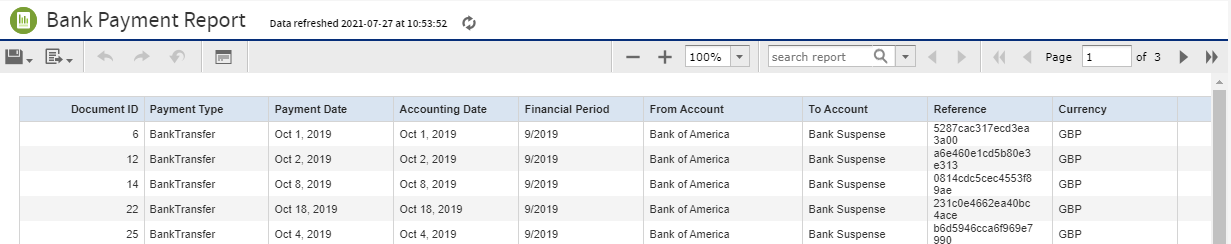
Bank Payment Report
This report uses the Finance domain > Finance Payment Receipts
The bank payment report lists all payments from their respective banks to other accounts.
Report Filters
- Accounting Date - Date range 'From date' and 'To date' can be selected
- From Account - Displays debit account name
- To Account - Displays credit account name
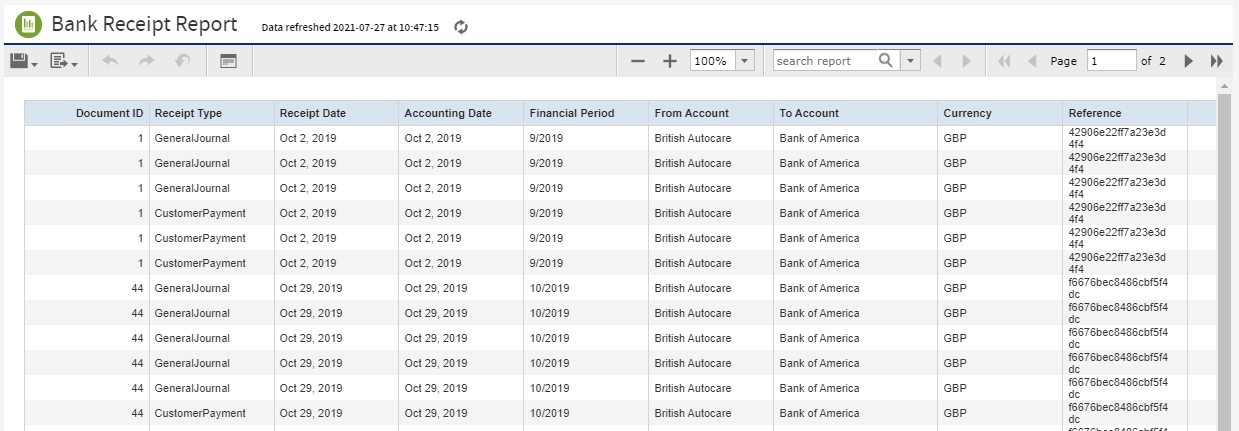
Bank Receipt Report
This report uses the Finance domain > Finance Payment Receipts
The bank receipt report lists all receipt types and values received into the Bank account
Report Filters
- Accounting Date - Date range 'From date' and 'To date' can be selected
- From Account - Displays debit account name
- To Account - Bank account where value is credited
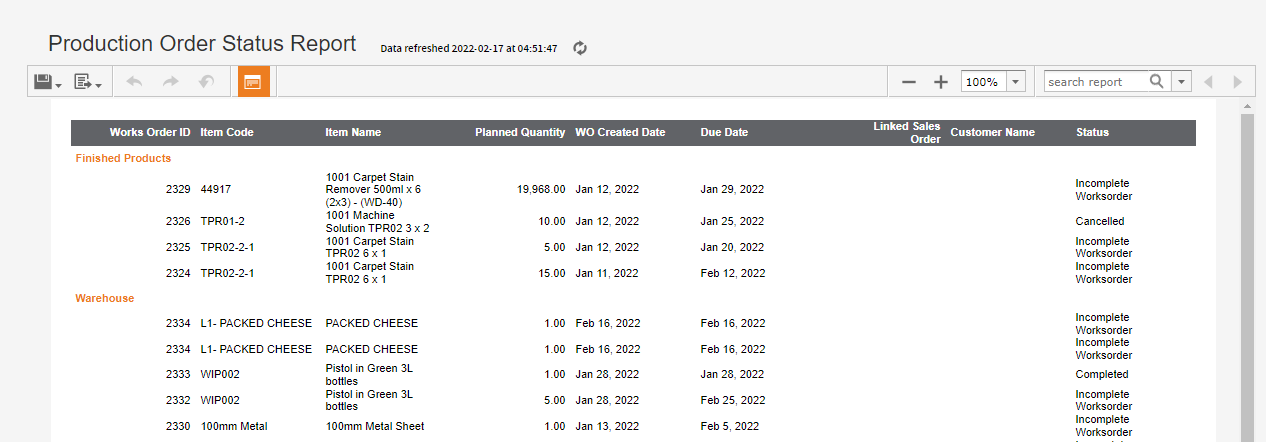
Production Order Status Report
This report uses the Operation domain > Works Order set
The report lists status wise works order grouped by location and excludes items which are obsoleted. If a works order is linked with Sales Order, then customer name and Sales Order ID can also be viewed in the report.
Report Filters
- Item Name - Can be filtered with one or multiple items
- Due Date - Can be filtered with date range
- Status - Can be filtered with one or multiple status
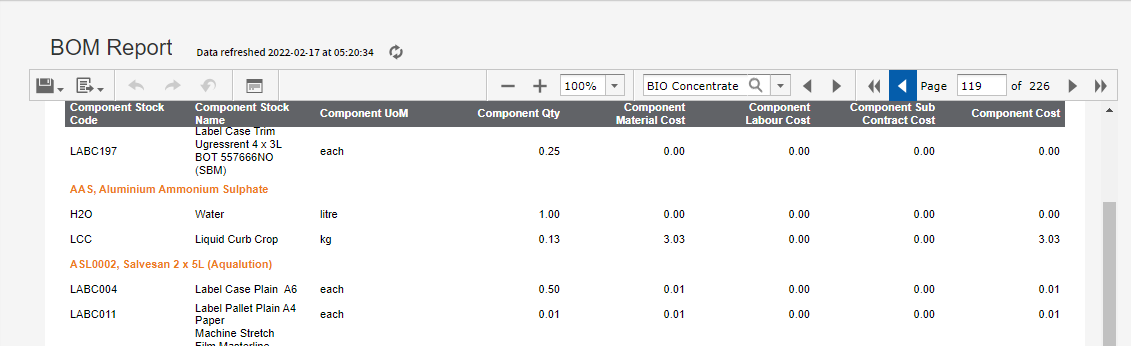
BOM Report
This report uses the Stock domain > Stock and Stock component details set
The report lists Component items for manufactured stock items. This report is grouped by stock code and stock name
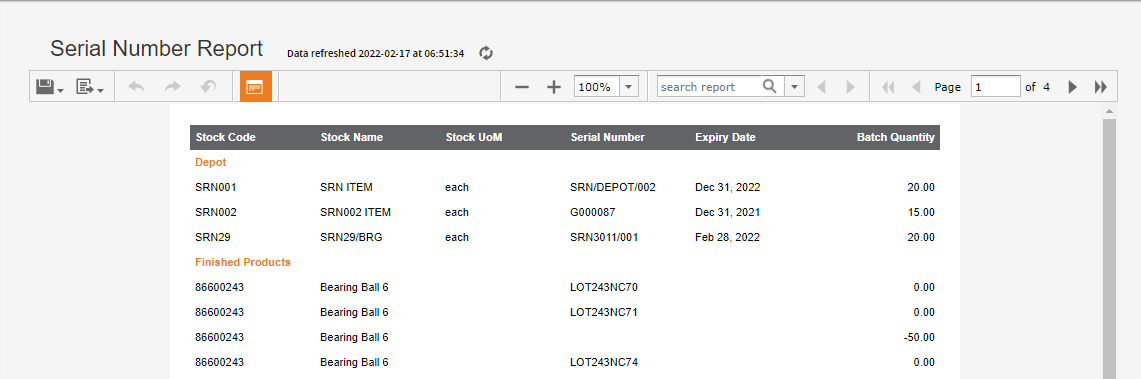
Serial Number Report
This report uses the Stock domain > Stock set
This report lists items which has serial number to it. Report is grouped by stock location and shows Batch quantity Serial number wise for an item.
Report Filters
- Serial Number - Can be filtered by one or multiple serial numbers
- Item Name - One or multiple stock item can be filtered
- Location - Can be filtered by stock locations
Standard Dashboards
Standard dashboards are built from ‘Ad Hoc Views’, a collection of specified data fields selected from domain sets. These dashboards can be viewed from 'My Dashboard' menu
The following example standard dashboards can be used for reference:
Sales Revenue Dashboard
Sales revenue dashboard can be viewed from My Dashboards > Sales
The sales revenue dashboard displays business revenue generated from sales for a calendar year. Sales revenue can be compared by year as well as by month to display sales trends
This dashboard includes two dashlets
- Yearly Sales Revenue - This dashlet displays yearly sales revenue. Clicking on the pie area for any year will refresh the monthly sales revenue dashlet which will display the monthly sales revenue breakdown for a year.
- Monthly Sales Revenue - This dashlet displays the monthly breakdown of sales revenue for the calendar year.
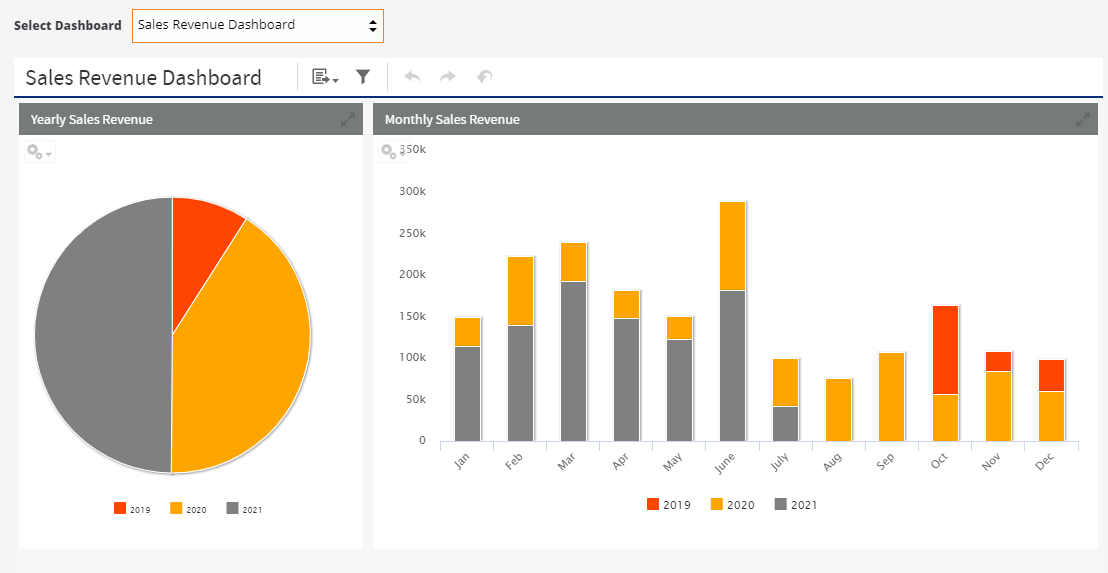
Monthly Sales Revenue can be drilled into further for a more detailed report together with the items and sales revenue account.
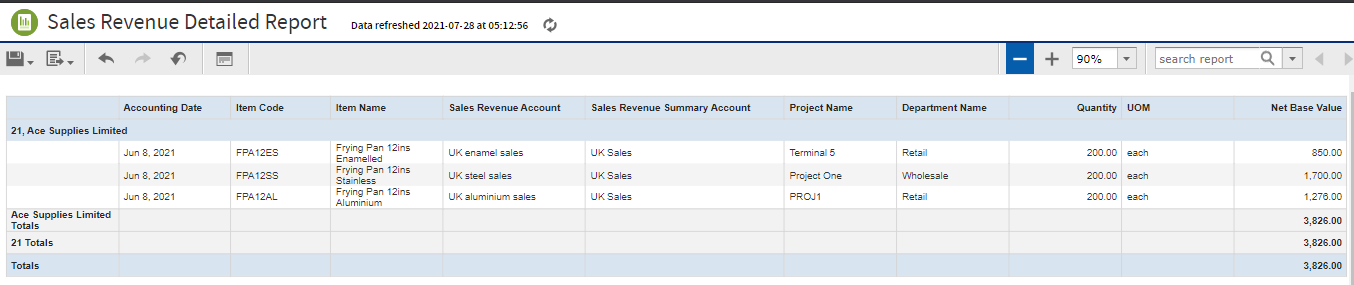
The sales revenue dashboard includes the following filters which are also available as drill through options from the 'Sales Revenue Detailed Report'
- Year
- Sales revenue summary account
- Customer name
- Project
- Department
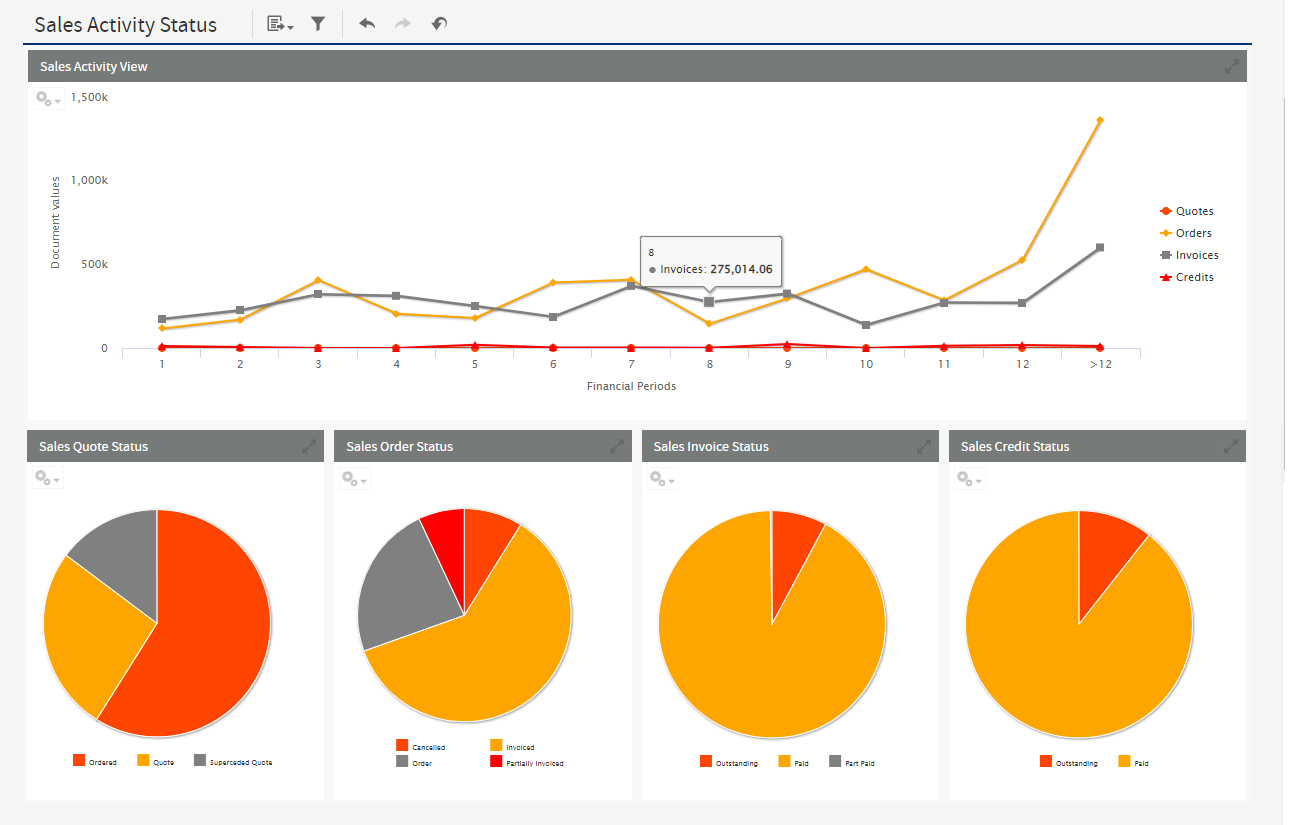
Sales Activity
Sales Activity dashboard can be viewed from My Dashboards > Sales
The sales activity dashboard displays financial period wise values of sales Quote, Sales Orders, Sales Invoices and Sales credit note for the selected financial year.
This dashboard includes following dashlets;
Sales Activity
- Sales Activity KPI shows trend of sales values document wise for selected financial year.
- This dashlet interacts with Sales document status which can be seen below this dashlet. On clicking any period value, all the dashlets of status refreshes and displays values as processed against respective financial period.
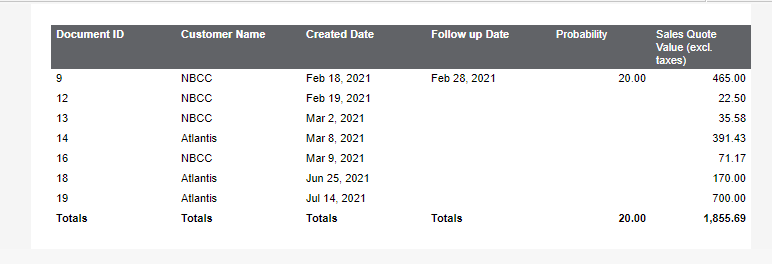
Sales Quote Status
- Sales Quote status wise values can be seen in this dashlet.
- This KPI can be drilled further to detailed report. Detailed report can be viewed for any status.
- Similar to Sales Quote status, other dashlets of Sales Order, Sales Invoices and Sales credit notes can also be drilled further to show more details of respective status of document.
Filters on Dashboard
Sales Activity Dashboard can be filtered to show records for a financial year.
Sales Dashboard
Sales Dashboard can be viewed from My Dashboards > Sales
The Sales dashboard displays the sales performance supported by multiple KPI's
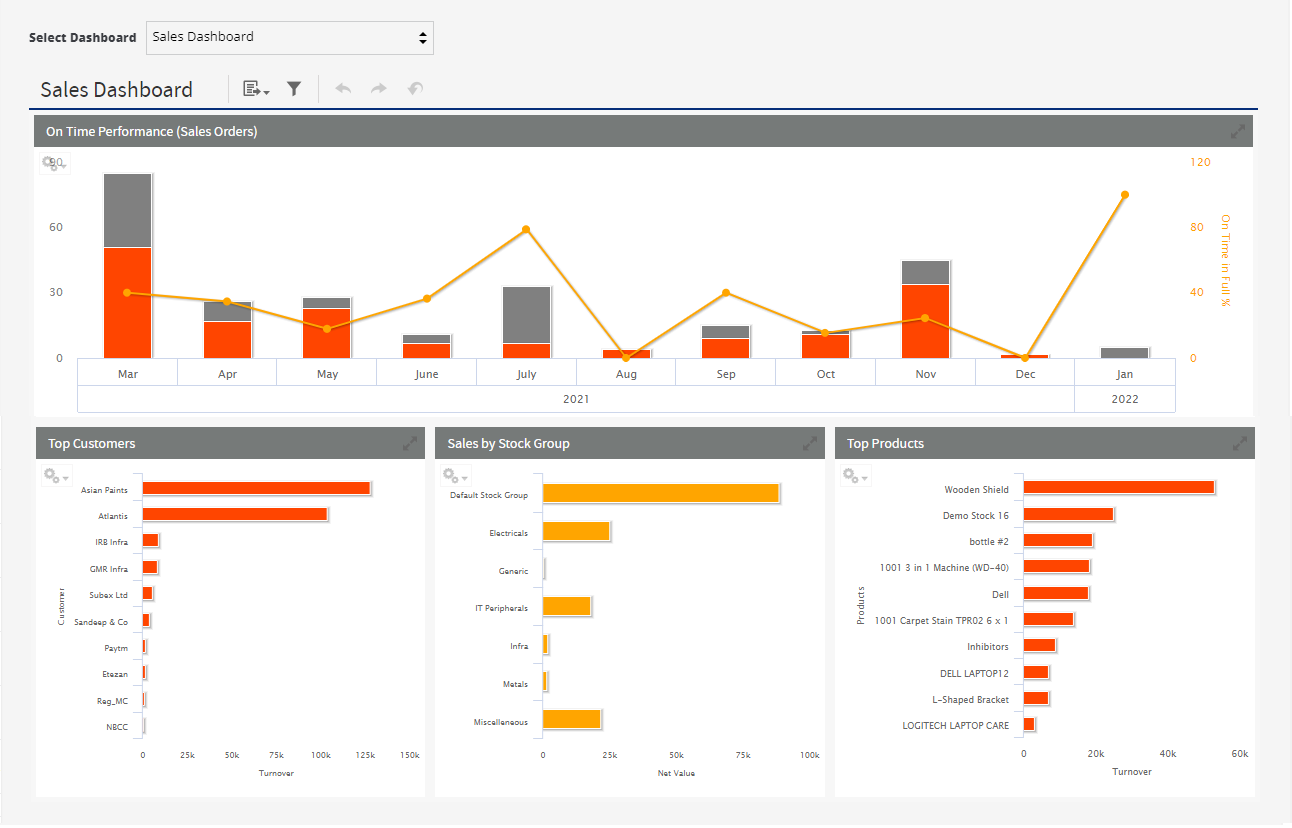
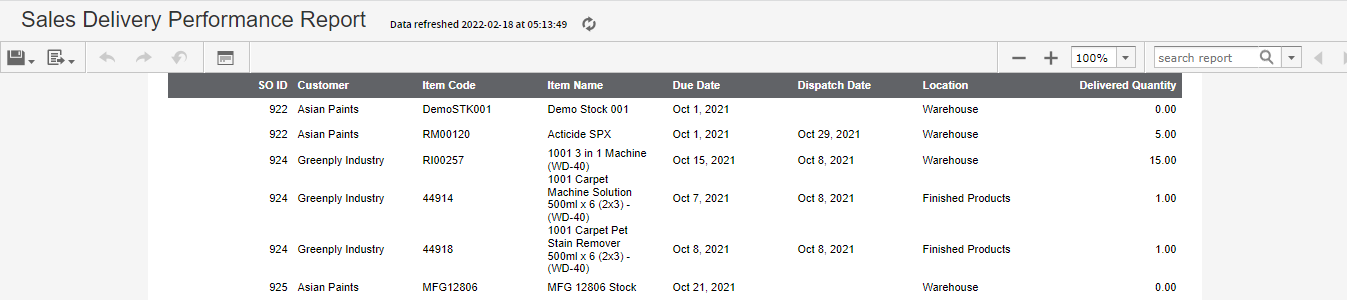
Ontime Performance (Sales Orders)
- The ‘Ontime Performance’ KPI displays the number of ‘on time’ and ‘late’ deliveries for order items by month. Sales order items delivered after their due date are reported as late deliveries. Items delivered on or before their due date are reported as on time deliveries.
- An ‘on time in full’ percentage trend by month can be viewed from the KPI
- The KPIs can be drilled into to open a ‘Sales Delivery Performance Report’ to show due and dispatch dates by item for their respective orders in greater detail
Top Customers
- The ‘Top Customers’ KPI displays the top 10 customers who contribute to the highest sales turnover values
- The KPI can be drilled into to open related KPIs showing sales turnover values by month for the selected customer. These can be further drilled into to report on actual sales invoice values
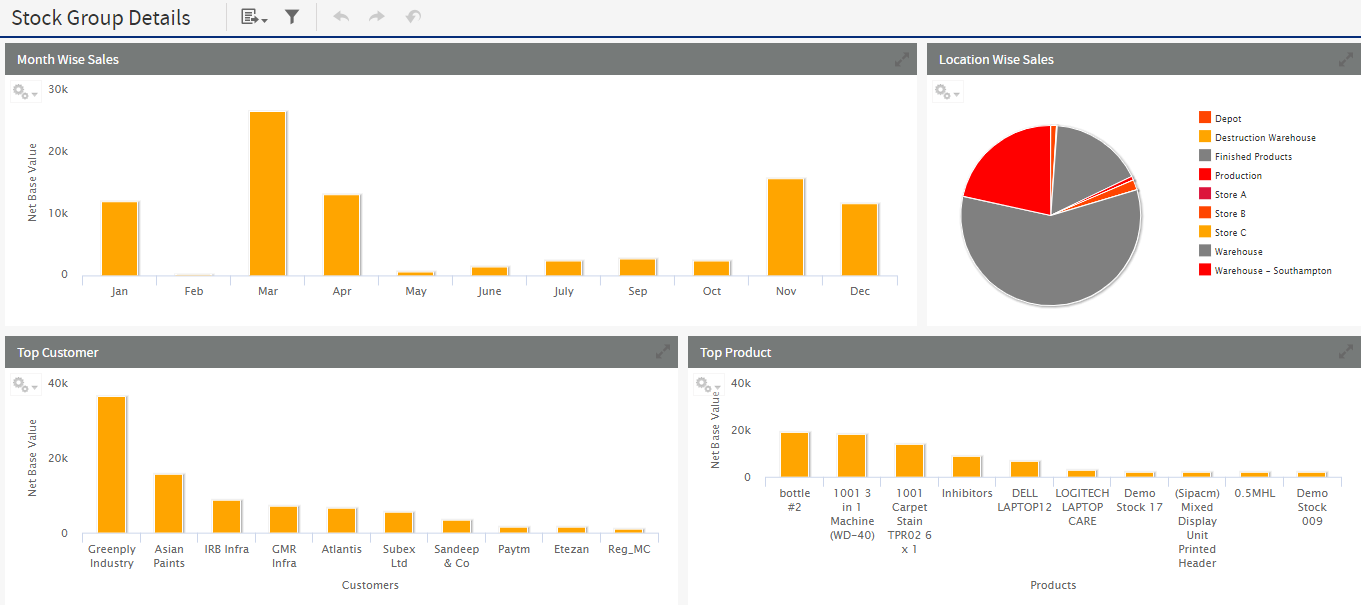
Sales by Stock Group
- The ‘Sales by Stock Group’ KPI displays sales revenue by stock group
- The KPI for stock group can be drilled into further to show sales trends for:
- Monthly sales - Interacts with Location sales, top customers and top selling products to show records of sales for the selected month.
- Location sales - Interacts with Top customer and Top selling products to display values as sold from respective location.
- Top Customers
- Top Selling Products
Top Products
- The ‘Top Products’ KPI displays the top 10 products that contribute to the highest sales turnover. This reports stock items only.
- The KPI can be drilled into to open detailed report showing stock turnover values by month for the selected product.
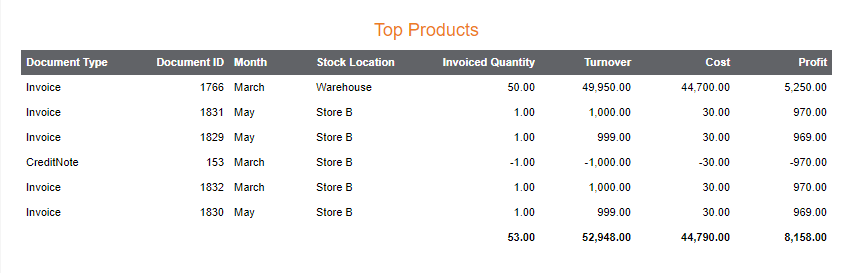
- Top Product report can be filtered by stock items too in order to view turnover records for other stock items.
Filters in Dashboard
From & To Date The filter defaults to show current month and past eleven months data.
This can be filtered by date range
Customer Options to filter by one or multiple customers
Stock Group Options to filter by one of multiple stock groups
Working Capital Dashboard
The Working capital dashboard can be viewed from My Dashboards > Finance
The Working Capital Dashboard is designed to provide a measurement of company’s short-term financial health and can be filtered for single calendar year.
Working capital is defined as the difference between current assets and current liabilities.
The Working Capital Dashboard includes three dashlets;
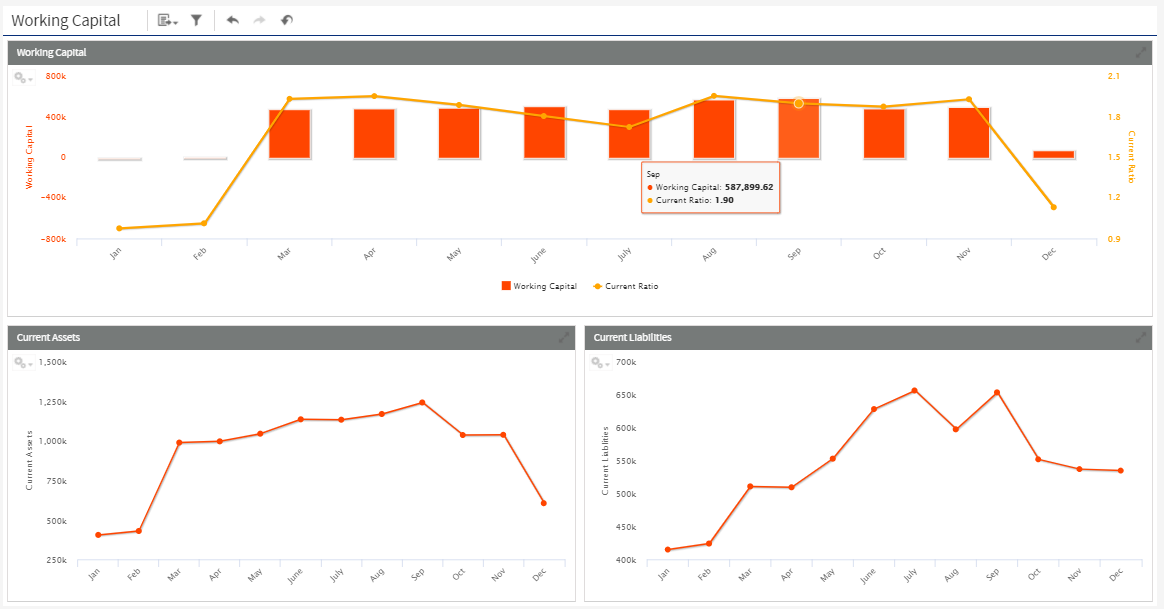
Working Capital
- Showing the monthly trend of working capital for Calendar year
- Trend of Current Ratio can be viewed with working Capital. The current ratio is a liquidity ratio that measures a company's ability to pay short-term obligations. Current ratio is calculated as (Current Assets / Current Liabilities)
Current Assets
- Showing the monthly trend of Current Assets. A higher trend of current asset indicates positive cashflow within business
Current Liabilities
- Showing the monthly trend of Current Liabilities. The trend for both current assets and liabilities illustrates how well working capital is managed on a monthly basis
Profit & Loss Dashboard
Profit & Loss Dashboard can be viewed from My Dashboards > Finance
There are two Dashboards for Profit & Loss
- CY Profit & Loss - Displaying highlights for calendar year
- FP Profit & Loss - Shows the Profit and loss based on financial years along with financial periods for revenue and expenses
On opening any dashboard, the values for one financial year are displayed. Users can apply filters to view the dashboard for single or multiple years
There are six dashlets included in profit & loss dashboard
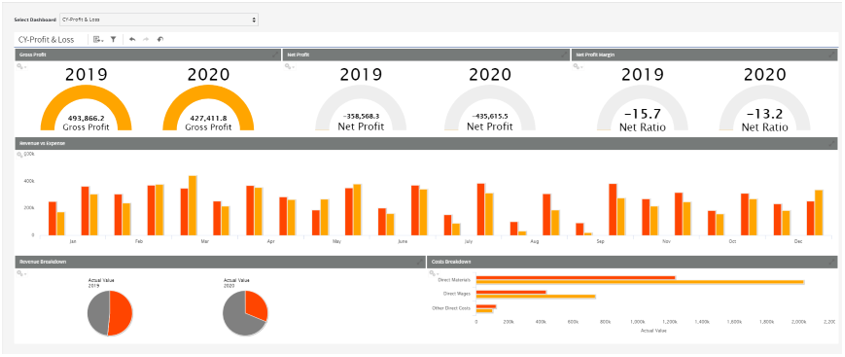
- Gross Profit - This is the profit that a company makes after deducting costs associated with making and selling its products. In other words, this is the amount of money earned
- Net Profit - Net Profit is also known as Net Income/Net earnings. It represents the financial standing of a company after all expenses have been paid
- Net Profit Margin - This ratio is used to represent a business’ net profit as a percentage based on sales revenue. The ratio shows how much of the sales revenue earned is a Net Profit. It is calculated as (Net Profit/ Sales Revenue) *100
- Revenue Vs Expenses - This KPI shows the Revenue and Expenses for a business
This KPI can be viewed by Calendar month and can be viewed by Financial period for the Financial Year
Note: For Financial Periods where there are more than 12 financial periods, the graph will display 12 periods. Periods 12 and later are consolidated into the bar displayed for period 12
There is drill through available in this KPI, which opens detailed report for revenue and for Expenses
- Revenue Breakdown - This shows breakdown of sales revenue. Immediate summary accounts that are viewed under Sales revenue can be seen in the chart
- Costs Breakdown - Shows direct costs breakdown for the financial or calendar year. Can be viewed for one or multiple years for comparison
Customer Vs Supplier Dashboard
Customers -v- Suppliers Dashboard can be viewed from My Dashboards > Finance > Customers -v- Suppliers. This dashboard displays Aged Debtor and Aged Creditor details with more filters and greater details to understand what data is accounted in each of the KPI. This dashboard includes following KPI’s:
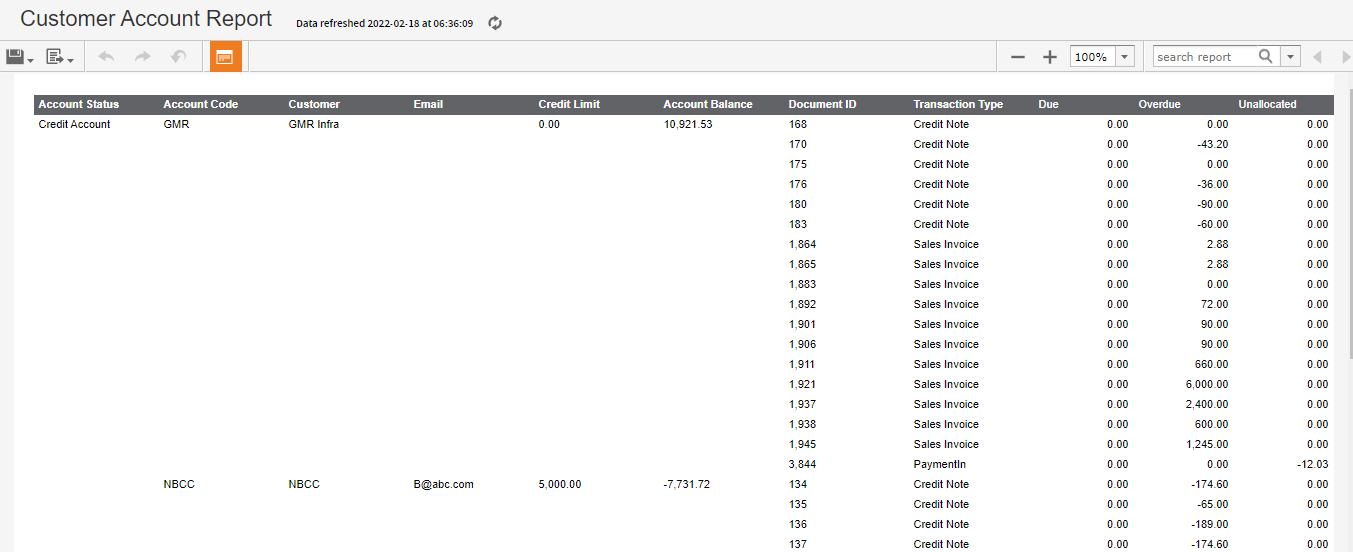
Customer Due -v- Overdue
This KPI displays a breakdown of due and overdue invoices awaiting payment from customers together with any unallocated receipts
This KPI can be drilled into for a detailed report ‘Customer Account Report’ to show documents that are due, overdue and any unallocated values for the customer
Supplier Due -v- Overdue
This KPI displays a breakdown of due and overdue invoices waiting to be paid to suppliers together with any unallocated payments
This KPI can be drilled into for a detailed report ‘Supplier Account Report’ to show documents that are due, overdue and any unallocated values for the supplier
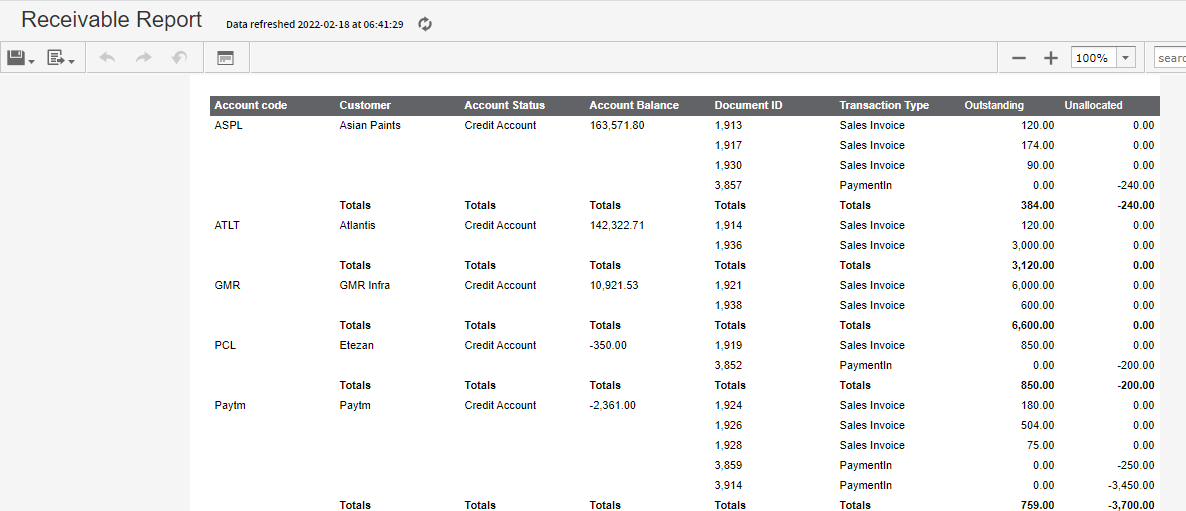
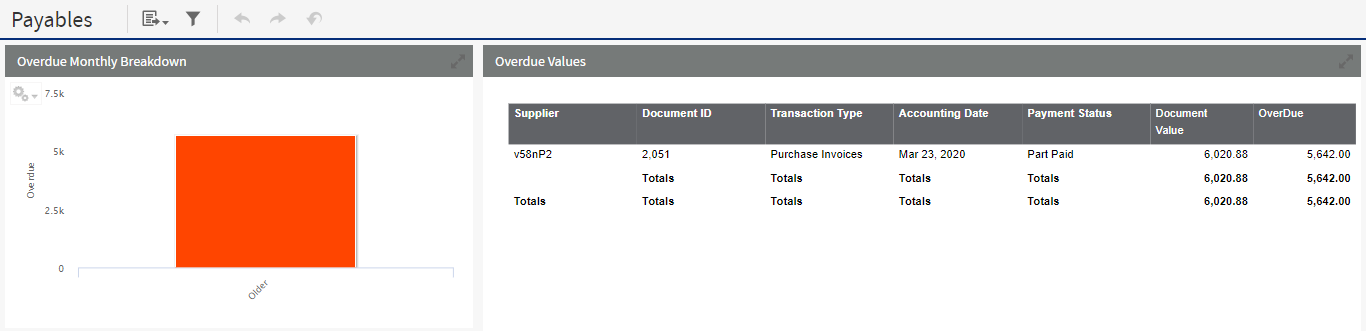
Aged Debtors -v- Aged Creditors
This KPI displays a breakdown of outstanding customer and supplier invoices for the current and previous 3 months together with previous outstanding values under the older bar
This KPI can be drilled into further to show a breakdown of outstanding invoices by customers when selected receivable bar to open 'Receivable Report' or for supplier when selected payables bar to open 'Payables Report'.
Customer Account Status
- This KPI displays outstanding amounts to be received from customers by customer status as stored against customer account.
- This KPI can be drilled into further to show a breakdown of due, overdue and any unallocated receipts by the customer status
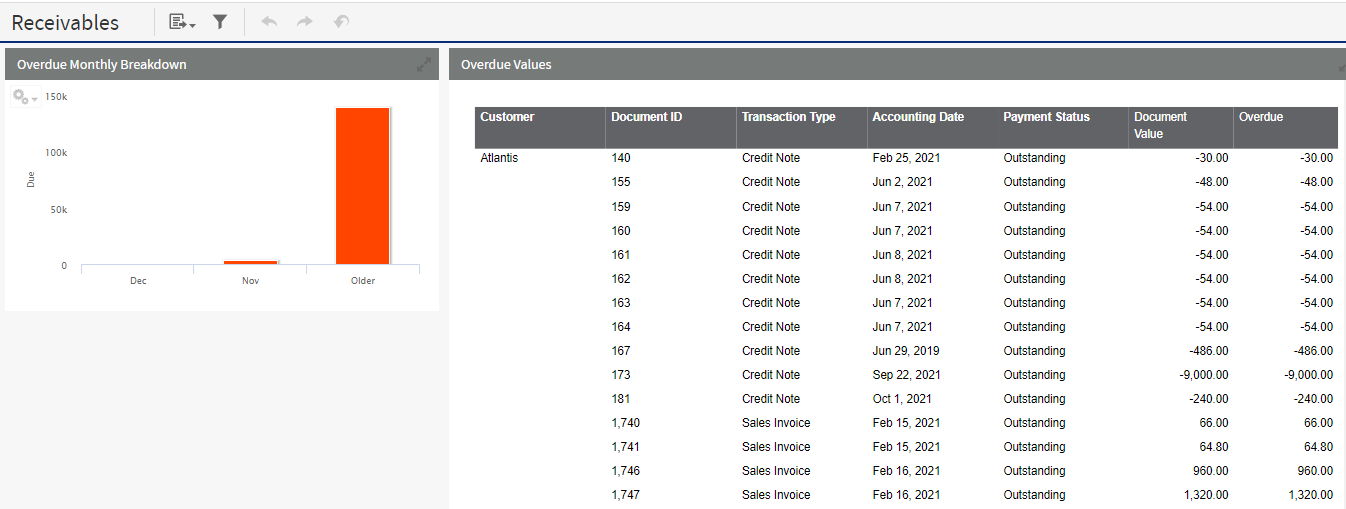
Top Overdue Customers
- KPI lists the top 10 customers with the highest overdue amounts outstanding. If the Sales invoice passes the payment due date than invoice value is accounted in this KPI
- This KPI can be drilled into further to show a breakdown of overdue values for customers for the current and previous months together with a report that interacts with the KPI to show document details.
Top Overdue Suppliers
- KPI lists Top 10 suppliers with the higher overdue amounts outstanding to be paid. If the Purchase invoice passes the payment due date than invoice value is accounted in this KPI
- This KPI can be drilled into further to show a breakdown of overdue values for suppliers for the current and previous months together with a report that interacts with the KPI to show document details
Filters in Dashboard
Customer Can be filtered by one or multiple customers
Supplier Can be filtered by one or multiple suppliers
Cash Management Dashboard
Cash Management Dashboard can be viewed from My Dashboards > Finance
Cash management dashboard aims to provide performance of Money In and Money out from Banks such that the liquidity of the firm and its’ capacity to pay bills can be ascertained.
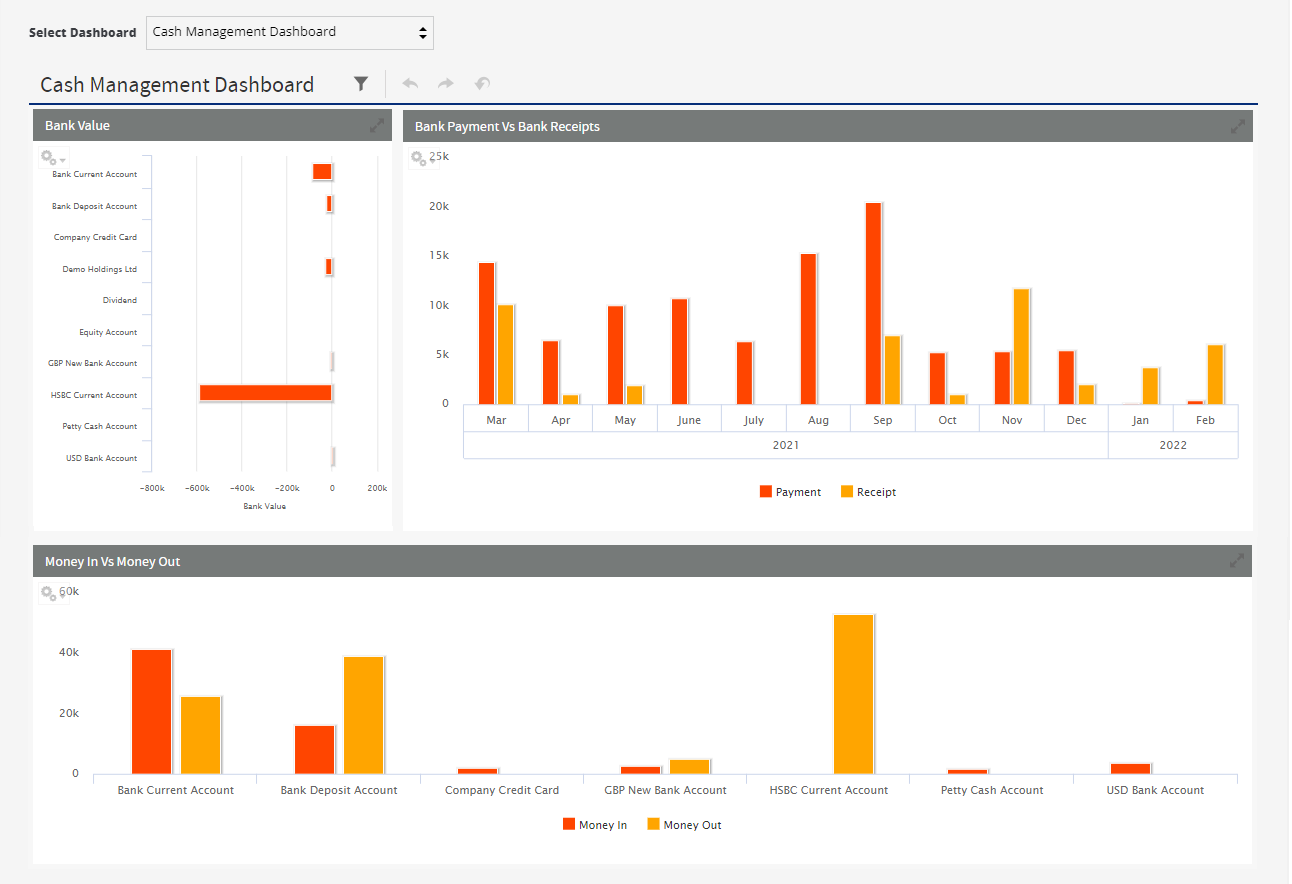
Bank Value
- Current Bank value against each Bank Account can be viewed from this KPI. The values are displayed in base currency.
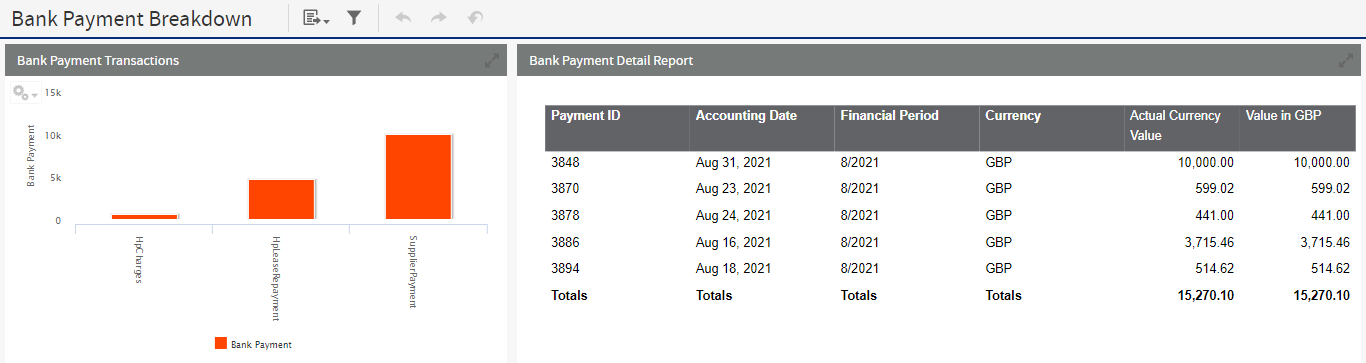
Bank Payments vs Bank Receipts
- The KPI displays month wise Bank Payments and Bank Receipts values as accounted in base currency.
- This KPI can be drilled into further to show a breakdown of receipts and payments with a report that interacts with the KPI to show document details.
Money In vs Money Out
This KPI represents Bank wise Money In and Money out for the filtered period.
Filters in Dashboard
From & To Date The filter defaults to show current month and past eleven months data.
This can be filtered by date range
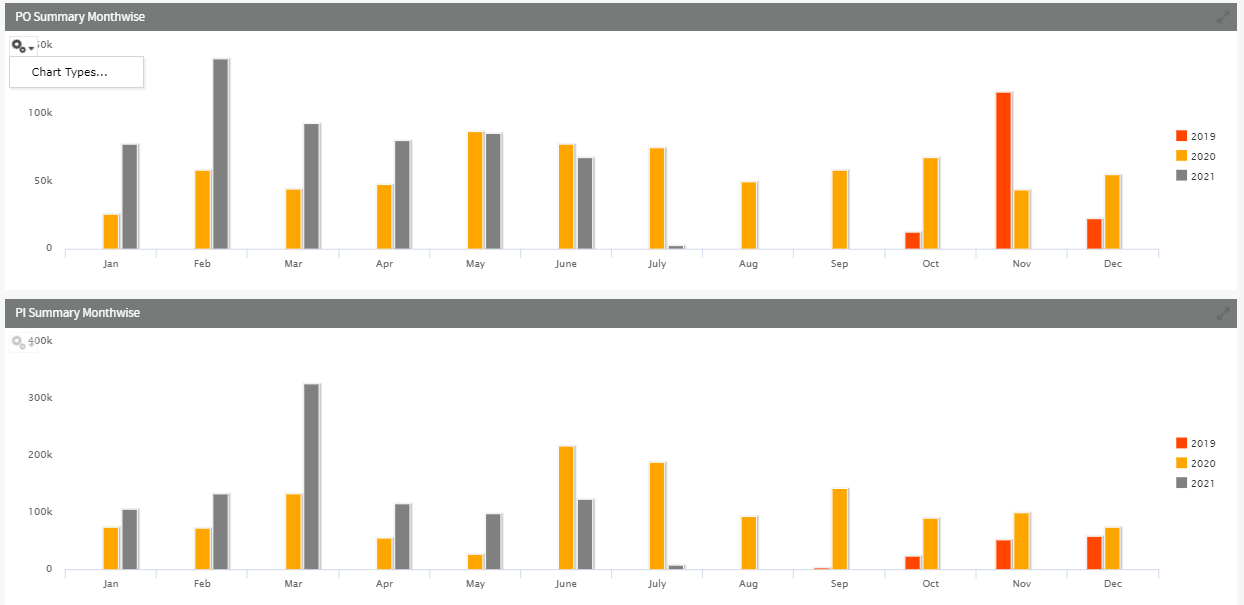
Purchase Activity Dashboard
Purchase Activity Dashboard can be viewed from My Dashboards > Purchase
This dashboard is designed to provide highlights of monthly Purchase Order and Purchase Invoice values for the calendar year. Users can apply a filter to see the dashboard for single or multiple years
Purchase Activity Dashboard includes two KPI's
- PO Summary by Month - Detailed report as drill through can be viewed by clicking any bar in the KPI
- PI Summary by Month - Detailed report as drill through can be viewed by clicking any bar in the KPI
Stock Summary Dashboard
Stock Summary Dashboard can be viewed from My Dashboards > Stock.
Stock summary dashboard is designed to provide highlights of top selling and procurement items. This dashboard can be viewed by applying filters for a single calendar year. This dashboard inclues 4 KPI's:
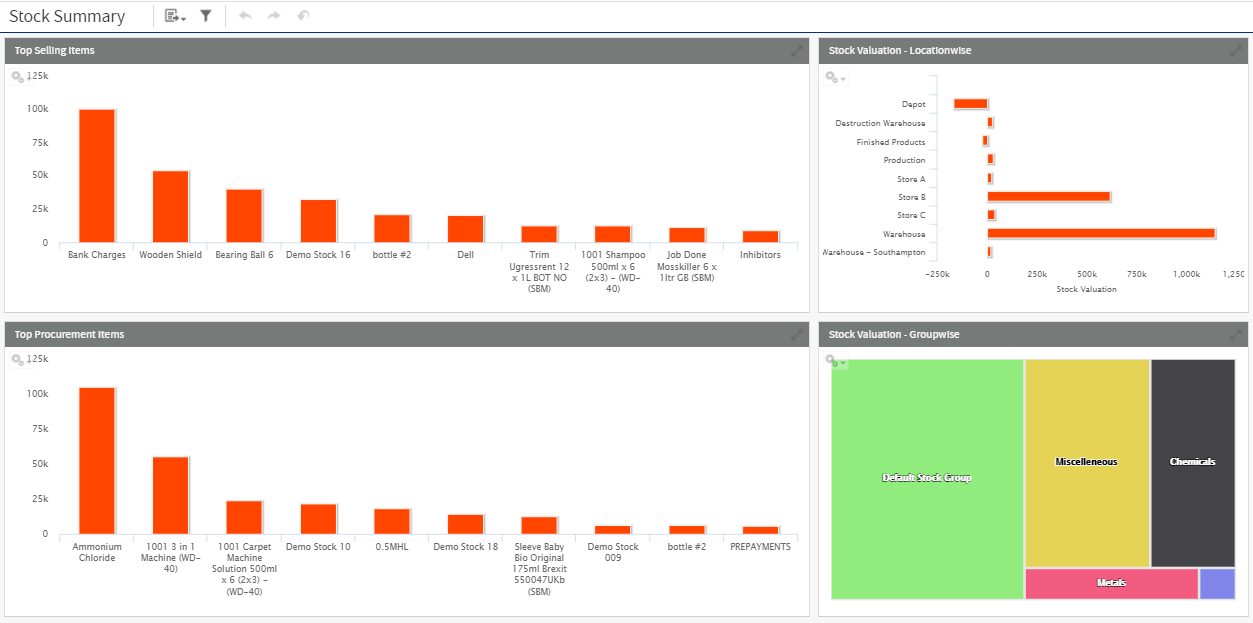
- Top Selling Items - This dashlet uses fields from Sales domain > Sales Invoice. This shows the top 10 selling items in terms of items with higher sales values. This dashlet can be further drilled through to other KPIs that show monthly sales values for the item
- Top Procurement items - This dashlet uses fields from Purchase domain > Purchase Invoice. This shows the top 10 procurement items in terms of items with higher purchase value. This dashlet can be further drilled through to another KPI which shows monthly purchase values for the item
- Stock Valuation - This KPI shows the valuation of stock by location as at current date
- Stock Group Valuation - This KPI shows stock valuation by group. On clicking any stock group, will refresh the top selling and top procurement KPI such that both KPI shows the top items of the particular stock group
CRM Dashboard
CRM Dashboard can be viewed from My Dashboards > CRM
The sample CRM Dashboard shows 4 dashlets and displays the highlights for a calendar year
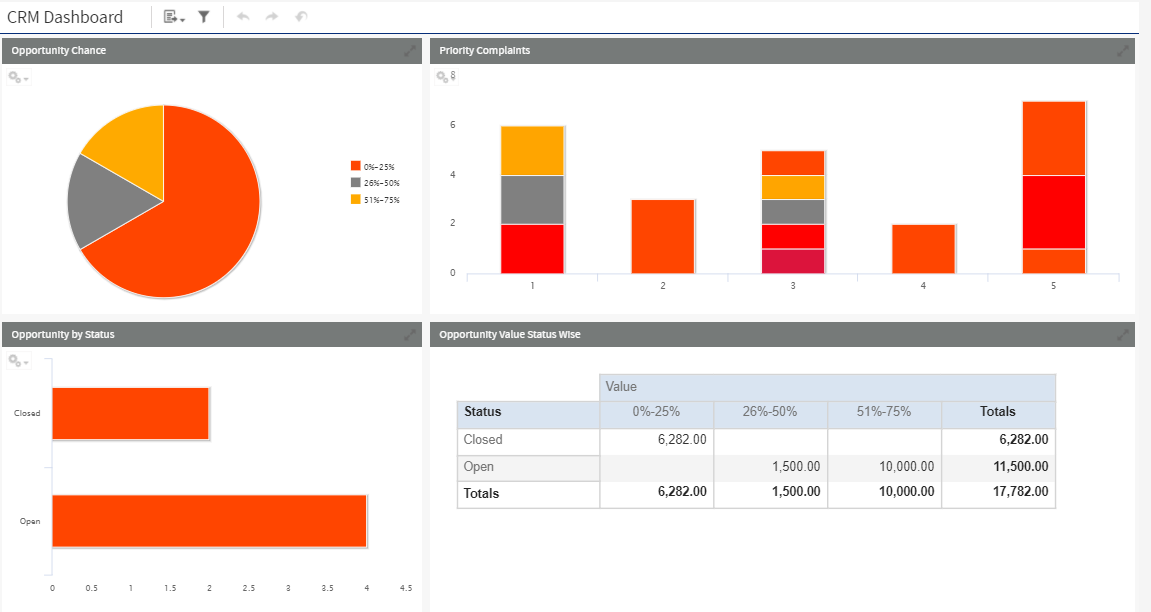
- Opportunity Chance – This shows the count of opportunities which are falling in respective range of opportunity conversion. There is interaction from this dashlet to ‘Opportunity by status’, clicking any range will update ‘Opportunity by Status’ that shows the status of opportunity counts falling in the range
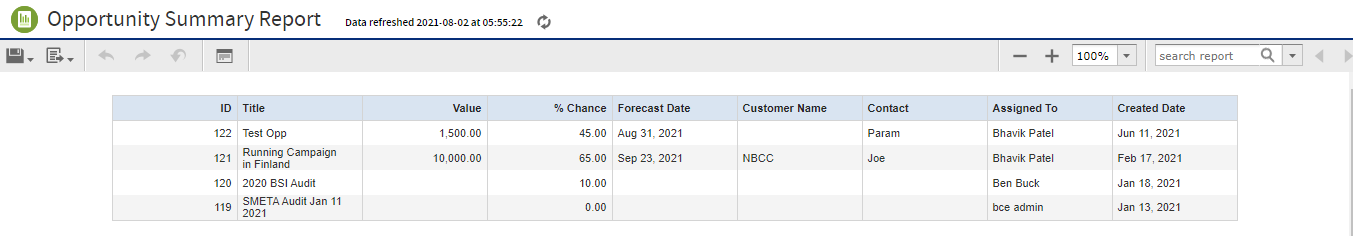
- Opportunity by Status – This shows a count of opportunities that belong to a respective status. Drill through is added which takes user to the Opportunity Summary Report from this dashlet
- Opportunity Value Status wise – This is represented in cross tab and displays the status and range of opportunity with opportunity value.
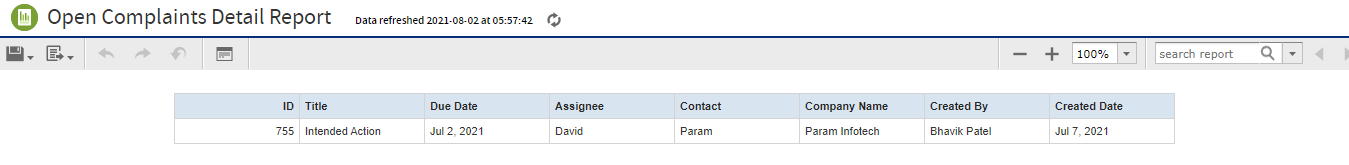
- Priority Complaints – This shows a count of open complaints by moth distributed within the respective priority. A drill through report is available on this dashlet that shows more detailed information for complaints
Operations Dashboard
Operations Dashboard can be viewed from My Dashboards > Operation.
Operation dashboard is supported with multiple KPI's as listed below;
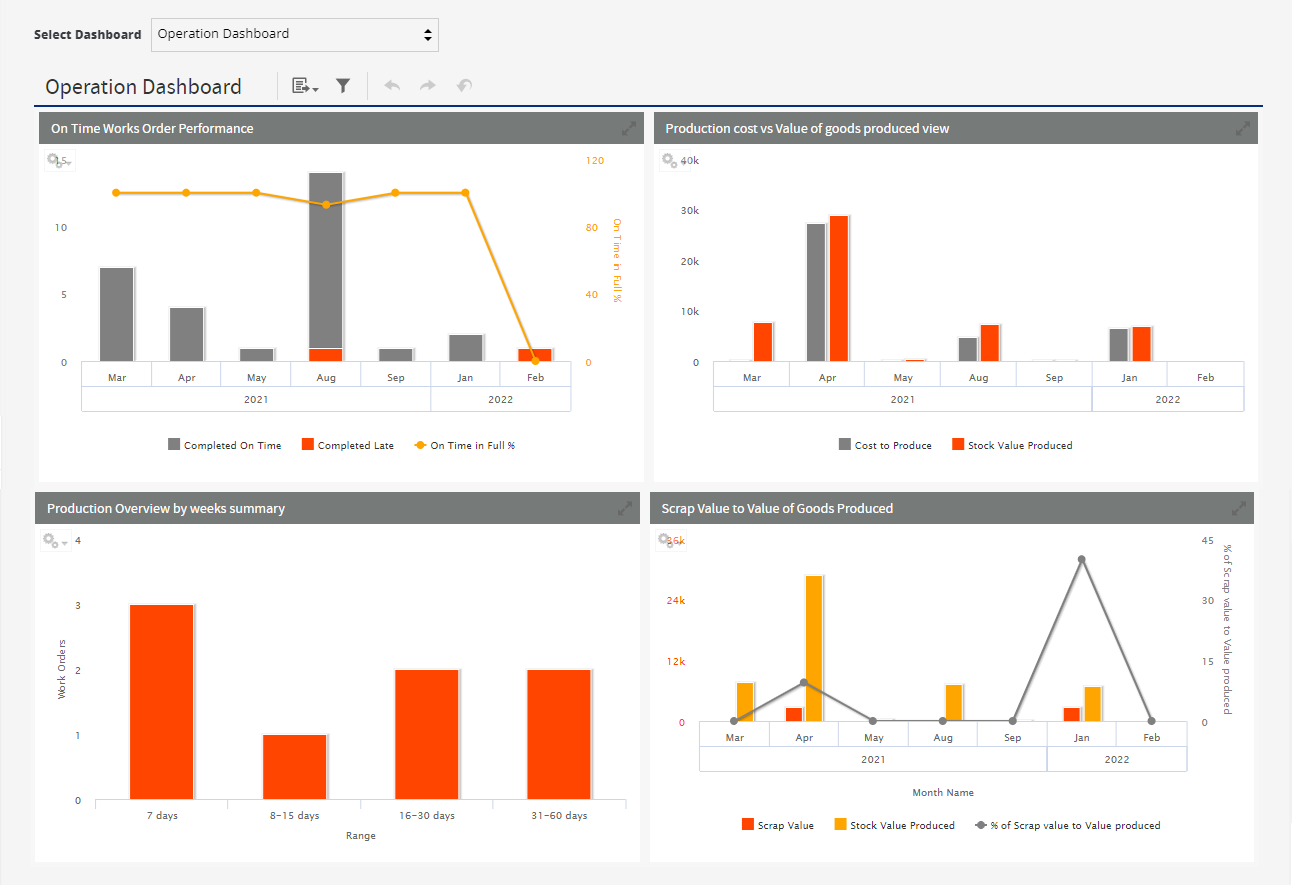
On time Works Order Performance
- This KPI shows counts of Works orders completed On time vs Completed late month wise for selected period. The filter defaults to show current month and past eleven months data.
- Works order which are completed before or on due date are counted as Ontime completion and Works order which are completed after due date is passed is counted as Late completion.
- Trend line to indicate % of works order completed on time can also be viewed on the KPI.
- Works Order which are of Cancelled status are not accounted in this KPI.
User can drill through this KPI to view report of Orders accounted both (Completed on time vs Late) from the bar chart
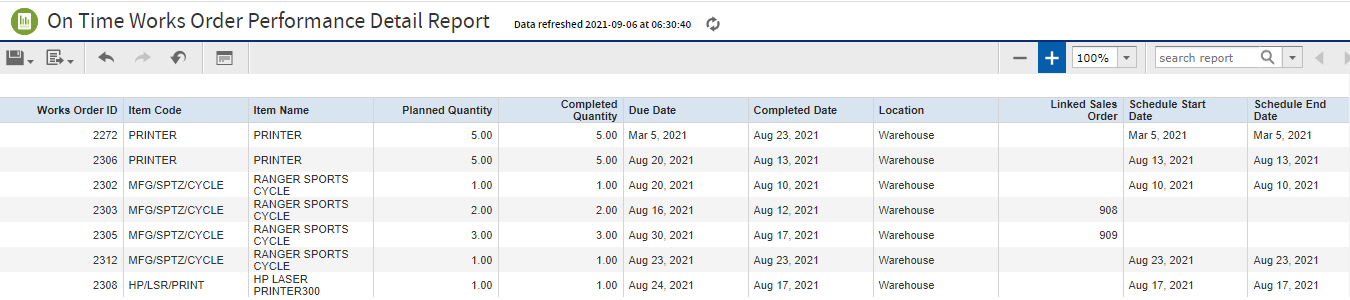
Input controls can be used to view Late completion or Ontime completed works orders.
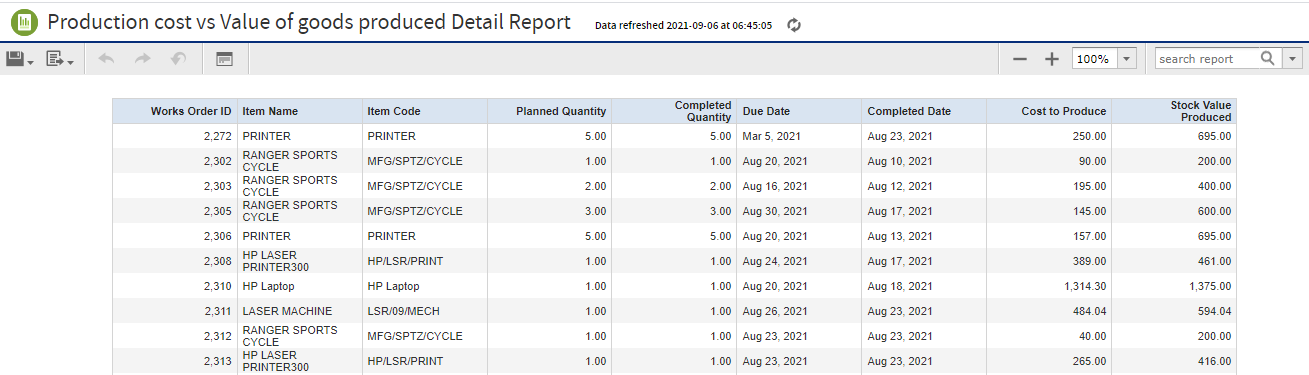
Production Costs vs Value of Goods Produced
This KPI shows monthwise 'Cost vs Value of goods produced' for completed works Order.
This KPI doesn't account Cancelled Works Orders and accounts costs for processes for hours spent captured in Live process view screen of works order.
Costs is computed as : Material Cost of Components + Sub-Contract Cost of Components + Labour Hours of Components + (Hours spent captured in Live Process View * Resource cost)
This KPI can be drilled to report to view Works Order wise Cost vs value produced
Long term production overview
This KPI displays the count of works orders which are due for future period. This KPI can be further drilled to detailer report for greater details.
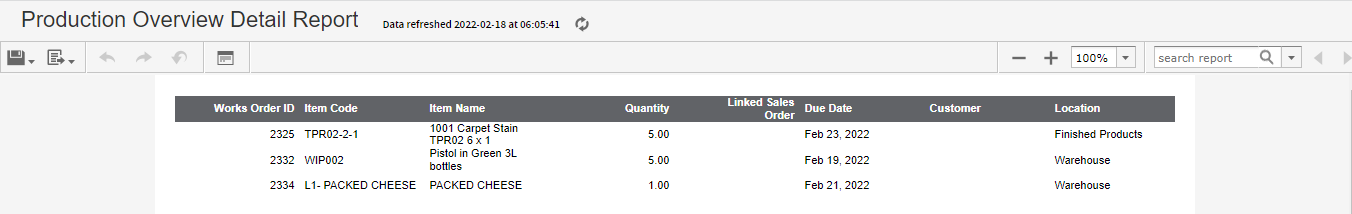
Note :- This KPI works independent and doesn't update to any filter applied in dashboard.
Scrap value to value of goods produced
- This KPI displays the value of ‘scrap’ and ‘goods produced' for works order items for the month.
- Scrap percentage trend by month can be viewed from the KPI
- The KPI can be drilled into to open a ‘Scrap value to value of goods produced report’ to show works order records in greater detail.
Note:- Operation Dashboard doesn't account Cancelled Works order.
Filters in Dashboard
From & To Date The filter defaults to show current month and past eleven months data.
This can be filtered by date range
Item Name Options to filter by one or multiple items
Stock Group Options to filter by one of multiple stock gro